Loading...
CR Prac. - Writing Linear Equations (A.2C)
Quiz by Valary Patterson
Track each student's skills and progress in your Mastery dashboards
Which situation is represented by the graph below?
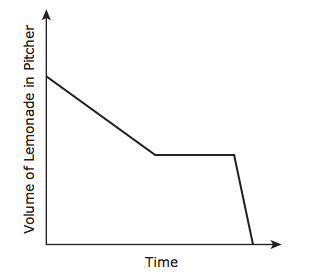
A woman poured lemonade from a full pitcher at a constant rate. Then for several seconds, she stopped pouring from the pitcher. Then the woman poured the rest of the lemonade from the pitcher at a slower rate than before.
A boy poured lemonade into an empty pitcher. Then for several seconds, he stopped pouring into the pitcher. Then the boy poured more lemonade into the pitcher at a slower rate than before.
A man poured lemonade from a full pitcher at a constant rate. Then for several seconds, he stopped pouring from the pitcher. Then the man poured the rest of the lemonade from the pitcher at a faster rate than before.
A girl poured lemonade into an empty pitcher. Then for several seconds, she stopped pouring into the pitcher. Then the girl poured more lemonade into the pitcher at a faster rate than before.
A factory worker packed 12 boxes at a constant rate, took a 30-minute break, and then continued packing boxes at twice the rate before the break. The worker then spent 1 hour cleaning the work area. Which graph models this situation?


Which situation is represented by the graph below?

A factory worker packed 12 boxes at a constant rate, took a 30-minute break, and then continued packing boxes at twice the rate before the break. The worker then spent 1 hour cleaning the work area. Which graph models this situation?
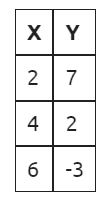
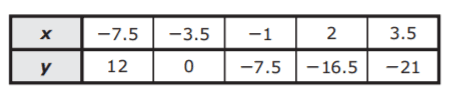
The table represents some points on the graph of a linear function. Which function represents the same relationship?
An organization has a monthly budget of x dollars. Every month 2,070 dollars is spent on salaries. One-fourth of the remaining budget is spent on monthly activities. Which function can be used to find the amount in dollars spent on monthly activities?
Researchers in Antarctica discovered a warm sea current under a glacier that is causing the glacier to melt. The ice shelf of the glacier had a thickness of approximately 450 m when it was first discovered. The thickness of the ice shelf is decreasing at an average rate of 0.06 m per day. Which function can be used to find the thickness of the ice shelf in meters x days since the discovery?
The table represents some points on the graph of a linear function. Which equation represents the same relationship?

The graph of a linear function is shown on the grid. Which equation is best represented by this graph?
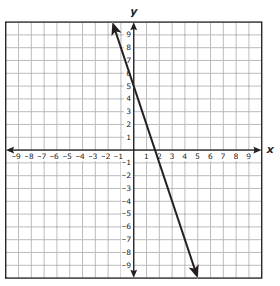
The graph of a linear function is shown on the grid.
Write the equation in slope intercept form that best represents the function.

The table below shows corresponding x and y values.
Which equation best represents the relationship in this table?