Loading...
Final Revision
Quiz by Amal
Tag the questions with any skills you have. Your dashboard will track each student's mastery of each skill.
Marco has been tracking the weather this season. Last week there were rain storms.
This week he saw this temperature chart on the news.
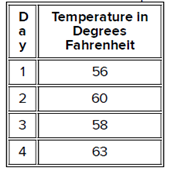
The season was summer and summer is typically very hot.
The season was spring and spring is typically cool.
The season was winter and winter is typically verycold.
Earth has ______seasons.
Marco has been tracking the weather this season. Last week there were rain storms.
This week he saw this temperature chart on the news.
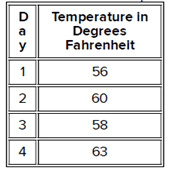
Places high up in the mountains tend to have __ climates than lower areas:
Brazil's temperature is between 70 and 80 degrees Fahrenheit all year long. Parts of Brazil
are very wet and get around 6.5 feet of rain each year.
Indonesia has temperatures between 79 and 82 degrees Fahrenheit all year long. There
can be up to 10 feet of rainfall each year.
Which conclusion can be made about Brazil and Indonesia?
A cold and wet climate will probably receive _______ precipitation.
Which best describes climate?
The chart shows the weather in Santa Rosa, California. It was recorded for two days during one month.
The days recorded were most likely during theseason of _______
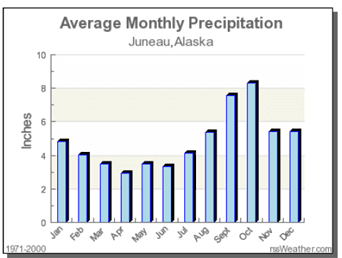
The graph shows precipitation recorded for each month of the year in Alaska.
Which statement is most likely true about fall in Alaska?
What are the hardened remains of living things that died long ago?
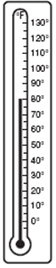
What temperature (in degrees Fahrenheit) does the thermometer show?
This is example of:
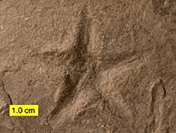
Fossils that are buried close to the surface are_____ than fossils buried deep in the ground
What type of animal does the fossil in the picture look like?
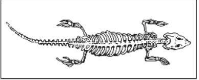
A fossil with fins shows that the animal most likely could _____
Which measures temperature?
Answer the questions using the weather map below:
Name two cities that will have high temperatures in the 90s.
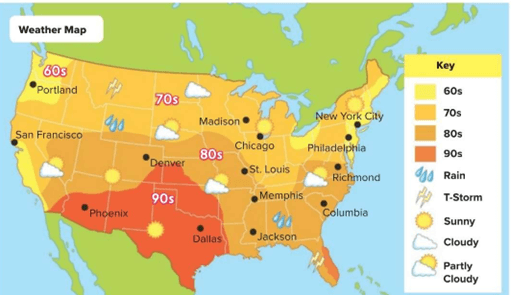
Answer the questions using the weather map below:
What will the weather be like in Chicago?
The weather will be ____________
Answer the questions using the weather map below:
What will the weather be like in San Francisco?
The weather will be ____________
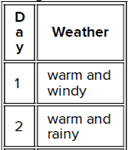
The chart shows the weather recorded for four different days throughout the year.
In which season did each day most likely occur?
Day 1 , the season will be _________
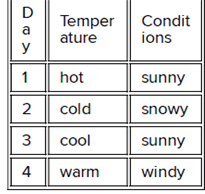
The chart shows the weather recorded for four different days throughout the year.
In which season did each day most likely occur?
Day 2 , the season will be _________