Loading...

FS L2: Data and Statistics
Quiz by TeamFS
Tag the questions with any skills you have. Your dashboard will track each student's mastery of each skill.
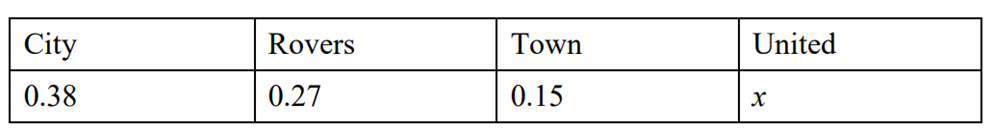
Four teams, City, Rovers, Town and United play a competition to win a cup. Only one team can win the cup. The table shows the probabilities of City or Rovers or Town winning the cup.
Work out the value of x.
0.22
0.19
0.21
0.2
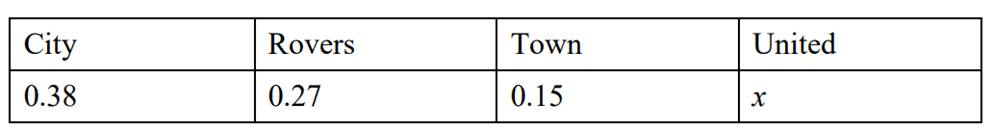
Four teams, City, Rovers, Town and United play a competition to win a cup. Only one team can win the cup. The table shows the probabilities of City or Rovers or Town winning the cup.
Work out the value of x.
Emily has a bag of 20 fruit flavoursweets. 7 of the sweets are strawberry flavour, 11 are lime flavour and 2 are lemon flavour. Emily takes at random a sweet from the bag. Write down the probability that Emily takes a strawberry flavour sweet
A box contains bricks which are orange or blue or brown or yellow. Duncan is going to choose one brick at random from the box. The table shows each of the probabilities that Duncan will choose an orange brick or a brown brick or a yellow brick.
Work out the probability that Duncan willchoose a blue brick.

Look at these numbers:
8, 5, 23, 11, 4, 12, 5, 9, 19
Work out the median of these numbers.
Look at these amounts:
138ml, 299ml, 1005ml, 203ml, 151ml, 4ml, 12ml, 15ml, 299ml
Work out the mode of these amounts.
The age of learners in a class is shown.
Work out the mean age for the learners in this class.

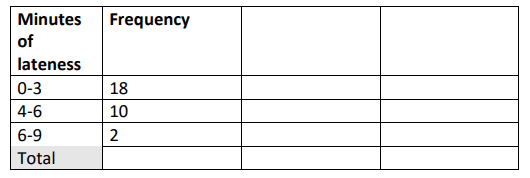
Annie goes to work by bus every morning. Sanjay, her friend, asks her how many minutes the bus is late on average, Annie records the minutes of lateness for amonth.
Estimate the mean number of minutes the bus is late for the month.
This is the daily spending for a week for Susan
Susan £10, £5.50, £7.10, £13, £8.80, £10, £20
What is her mean spend?
ABC Learning will be running a new course. They look at the ages of the people who have expressed an interest in the course, what is their average age?
25, 19, 29, 41, 32, 29, 25, 31, 22, 19, 20, 20, 20, 32, 28, 27, 21
The probability of raining tomorrow is 0.35.
What is the probability of not rainingtomorrow?
Write your answer as a fraction in its simplest form.
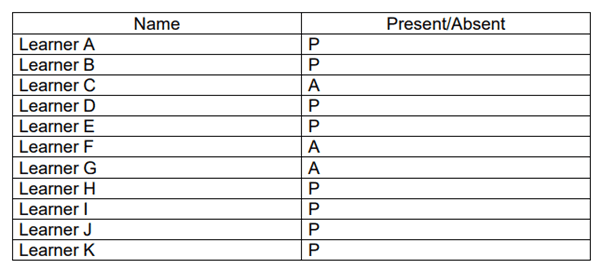
A teacher randomly picks the names of the students in the class to nominate them for a task. Here is how the register looks like.
What is the probability of an absent learner being picked?
Write your answer as a decimal, fraction and percentage
The correlation between tea sales in a local shop and the temperature is shown in the scatter diagram below.

Look at the scatter diagram.
What type of correlation is this?

Model building bricks are sold in sets.
The scatter diagram shows information about more sets that Noah sees for sale.
Use the scatter diagram to estimate the price of a set containing 3500 bricks.

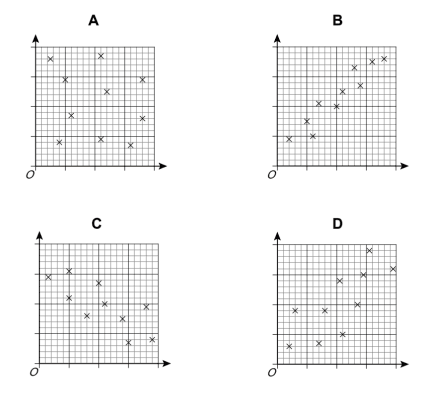
A, B, C and D are scatter diagrams.
Which diagram shows a negative corrilation?
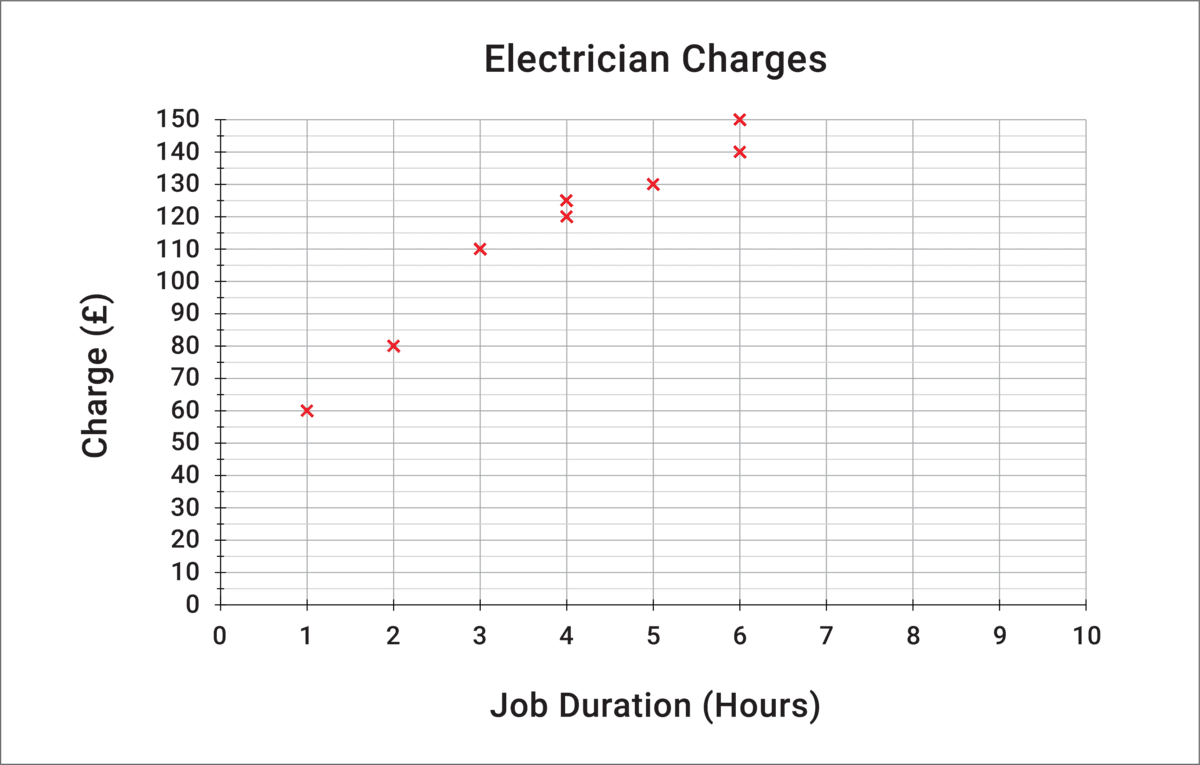
The graph shows the charge (£) by electricians for jobs of various durations (hours).
Describe the trend shown in the diagram.
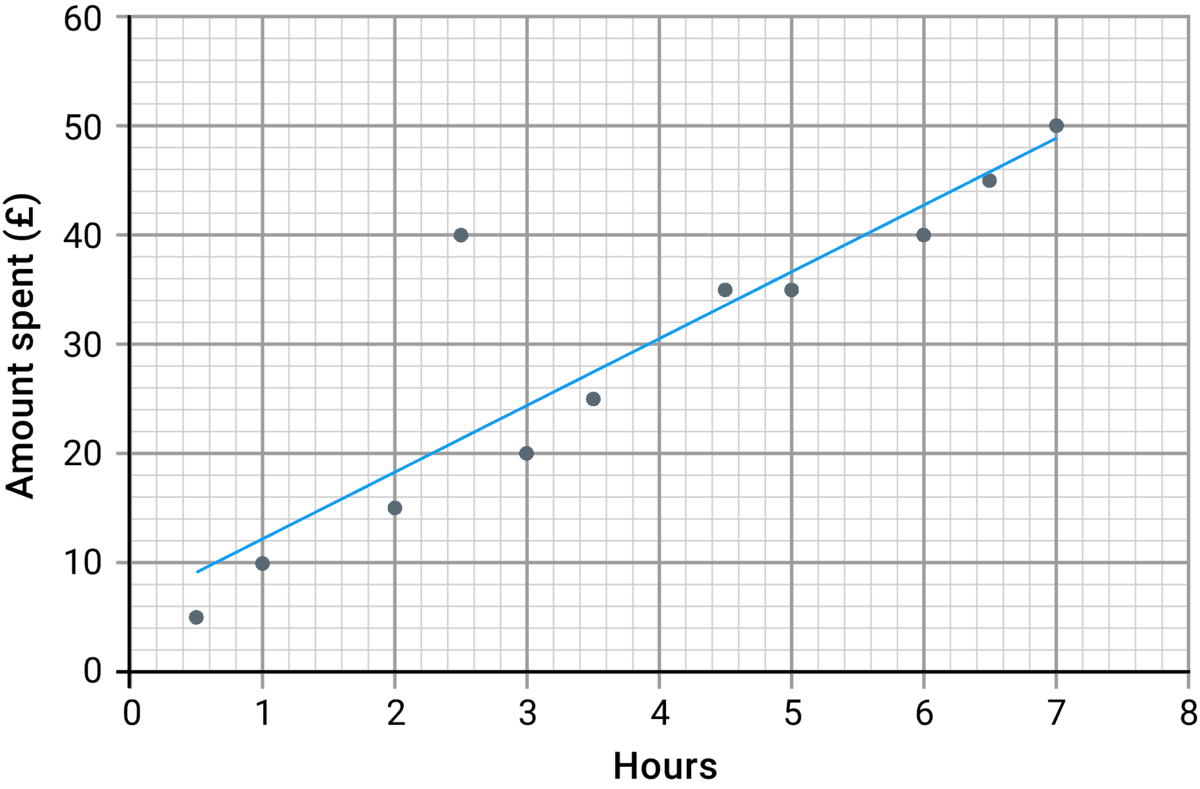
The graph below shows the amounts visitors spent at a tourist attraction (£) plotted against the time they spent there (hours).
Estimate the amount spent when a visitor stays at the tourist attraction for 4 hours.
Salma spends these amounts of shopping every day of the week: Monday: £13.30, Tuesday: £15.10, Wednesday: £11.00, Thursday: £14.95, Friday: £13.30, Saturday: £12.49 and Sunday: £12.89 .
What is the mode of her spending per day?
Thomas has 12 cards, each with a letter on it.
He picks a card at random.
What is the probability that the chosen card is a vowel?
