Tag the questions with any skills you have. Your dashboard will track each student's mastery of each skill.
Give this quiz to my class
Q 1/25
Score 0
Which of the following factors does not impact the infiltration rate of water?
60
The water table level
The porosity/permeability of the soil
The rate of Precipitation
The amount of pollution in a nearby stream
Q 2/25
Score 0
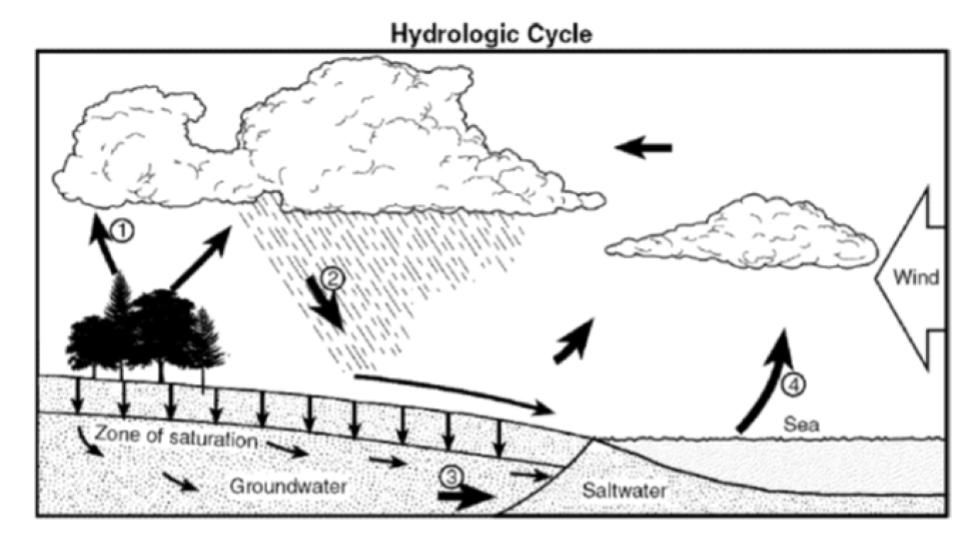
The following Diagram represents the water cycle...which of the following points represents evaporation?
60
Point1
Point 3
Point 2
Point 4
25 questions
Q.
Which of the following factors does not impact the infiltration rate of water?
1
60 sec
Q.
The following Diagram represents the water cycle...which of the following points represents evaporation?
2
60 sec
Q.
Which of the following statements is true concerning groundwater and surface water?
3
60 sec
Q.
The following map represents North Carolina's river basins...which river is likely to impact South Carolina if it becomes polluted?
4
60 sec
Q.
The map represents the global conveyor belt....what is the primary factor driving the current in the map?
5
60 sec
Q.
Four surface currents are represented on the map below...which of the following two ocean currents are more than likely cold?
6
60 sec
Q.
Why are ocean currents important to coastal regions?
7
60 sec
Q.
Which is formed when a section of impermeable rock forces groundwater to move laterally and emerge on the surface of the Earth?
8
60 sec
Q.
How is the beach structure below beneficial in protecting recreational beaches?
9
60 sec
Q.
Which of the following is true about seawalls?
10
60 sec
Q.
What is a drawback to the extensive use of irrigation?
11
60 sec
Q.
Which of the following factors can cause the salinity of a town well to increase?
12
60 sec
Q.
As human population increases exponentially what is likely to happen to the amount of available freshwater?
13
60 sec
Q.
A community decides to upgrade its wastewater treatment and water purification systems. What lasting impact could this have on available freshwater?
14
60 sec
Q.
The map represents the expansion of a community around a lake from 1967-1997...from 1967-1997 how is the quality of groundwater and surface water likely to change?
15
60 sec
Q.
High levels of which of the following physical properties of water is likely to improve the biotic index of a NC stream?
16
60 sec
Q.
Which is the most common contamination source for freshwater resources?
17
60 sec
Q.
Which of the following represents a non-point source of water pollution?
18
60 sec
Q.
The amount of available freshwater resources can be maximized by:
19
60 sec
Q.
Which of the following is true about man-made dams?
20
60 sec
Q.
How could the removal of trees and other vegetation impact an environment?
21
60 sec
Q.
Which of the following energy resources does NOT give off carbon dioxide when used?
22
60 sec
Q.
Which of the following is a characteristic of sustainable farming?
23
60 sec
Q.
In the diagram below where would be the best place to build a wind energy station?
24
60 sec
Q.
The diagram represents the extraction method for which natural resource?