Loading...
Identifica y construye transformaciones con figuras planas: rotación, traslación, reflexión.
Quiz by Jorge
Customize this quiz to suit your class
Instantly translate to 100+ languages
Tag the questions with any skills you have. Your dashboard will track each student's mastery of each skill.
Give this quiz to my class
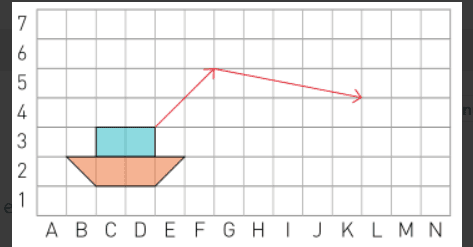
¿Qué tipo de transformación representa la siguiente imagen?
Traslación
Reflexión
Rotación
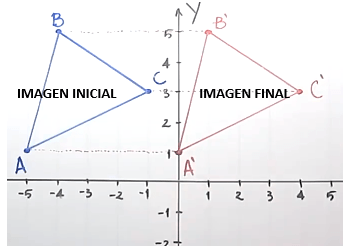
¿Qué tipo de transformación representa la imagen?

Traslación
Reflexión
Rotación
¿Qué tipo de transformación representa la siguiente imagen?

¿Qué tipo de transformación representa la imagen?
¿Qué tipo de transformación representa la imagen?
¿Qué tipo de transformación se encuentra en la figura ?
¿Qué tipo de transformación representa la imagen?

Traslaciones, reflexiones y rotaciones se conocen como
¿Qué es la rotación?
¿Qué es una transformación?
¿Cuál es el movimiento de forma perpendicular a un eje en donde todos los puntos se reflejan como en un espejo.?
¿Cuál de las alternativas es la correcta para completar una traslación?