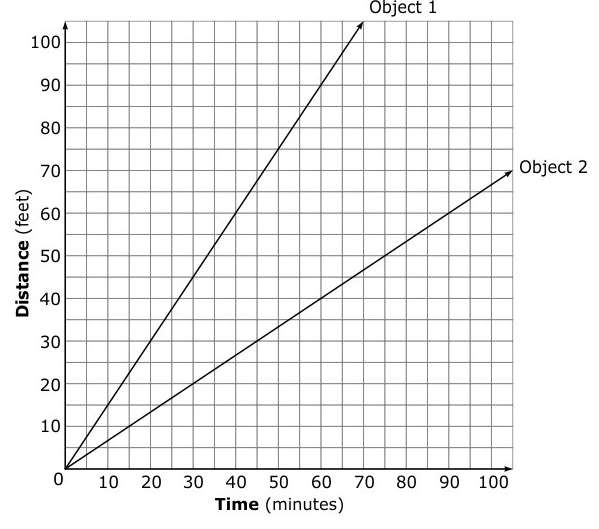
Understand that a proportion is a relationship of equality between ratios. o Represent proportional relationships using tables and graphs. o Recognize whether ratios are in a proportional relationship using tables and graphs. o Compare two different proportional relationships using tables, graphs, equations, and verbal descriptions.
Identify the unit rate (constant of proportionality) within two quantities in a proportional relationship using tables, graphs, equations, and verbal descriptions.
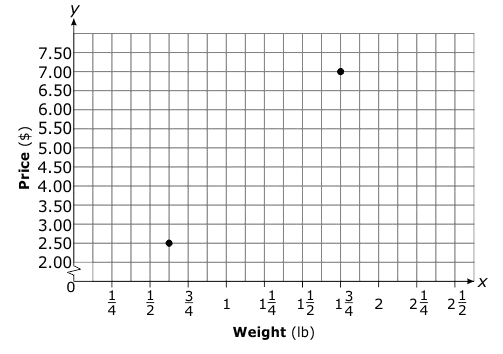
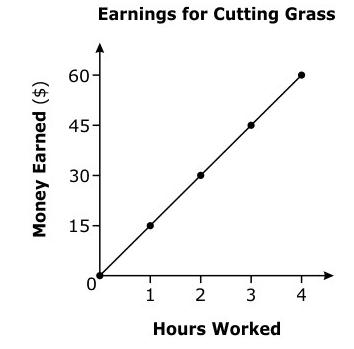
Use a graphical representation of a proportional relationship in context to: o Explain the meaning of any point (𝑥, 𝑦). o Explain the meaning of (0, 0) and why it is included. o Understand that the 𝑦-coordinate of the ordered pair (1, 𝑟) corresponds to the unit rate and explain its meaning.