Loading...

NY Released Test - Grade 8 Science (2025) (New York State P-12 Science Learning Standards)
Quiz by NYSED Science Grade 8
Track each student's skills and progress in your Mastery dashboards
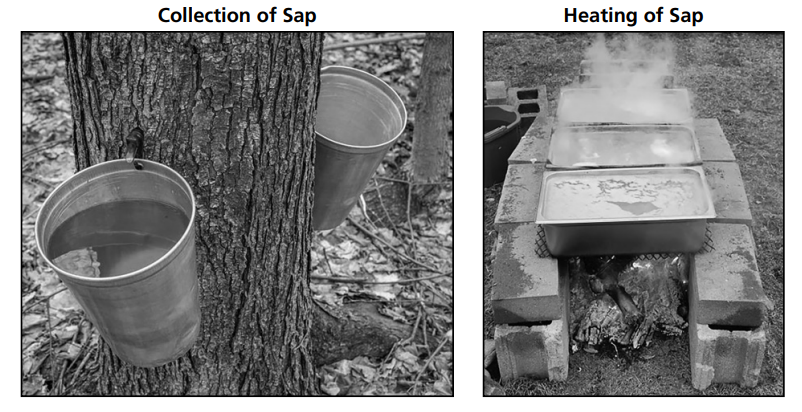
Maple Syrup Production
New York State is one of the leading producers of maple syrup. This process begins with inserting a spout into a maple tree. Sap (sugar water) flows into buckets for collection. The sap is then transferred into pans and heated to reduce the water content in sap to make the more concentrated maple syrup.
The photographs below show sap being collected in buckets and the sap being heated in three pans over a wood fire.
Which diagram describes what happens to the arrangement and motion of particles when thermal energy is added?


The sap must be heated for a long period of time to become syrup. The graph below shows the relationship between temperature and time for sap being heated over a wood fi re. Points X and Y represent temperatures of the sap at different times.
Which statement describes the temperature and the kinetic energy of the particles in sap as the sap is heated from point X to point Y?

The temperature and the kinetic energy remain the same.
The temperature remains the same and the kinetic energy increases.
The temperature increases and the kinetic energy remains the same.
The temperature and the kinetic energy increase.
Maple Syrup Production
New York State is one of the leading producers of maple syrup. This process begins with inserting a spout into a maple tree. Sap (sugar water) flows into buckets for collection. The sap is then transferred into pans and heated to reduce the water content in sap to make the more concentrated maple syrup.
The photographs below show sap being collected in buckets and the sap being heated in three pans over a wood fire.
Which diagram describes what happens to the arrangement and motion of particles when thermal energy is added?

The sap must be heated for a long period of time to become syrup. The graph below shows the relationship between temperature and time for sap being heated over a wood fi re. Points X and Y represent temperatures of the sap at different times.
Which statement describes the temperature and the kinetic energy of the particles in sap as the sap is heated from point X to point Y?

The graph below shows the change in density of collected liquid as maple sap is heated over time to produce maple syrup. It takes 40 gallons of sap to make 1 gallon of syrup.
A student is given two unlabeled 5-milliliter samples, one of which is maple sap and the other is maple syrup. Based on the information in the graph, which piece of evidence would best distinguish maple sap from maple syrup?

Maple syrup produced from maple trees is often called natural maple syrup. In addition to natural maple syrup, artificial maple syrup is produced to be used in cooking and as a topping. Artificial maple syrup is processed to mimic the taste and texture of natural maple syrup. The photos below show food labels from containers of both kinds of syrup.
Which statement explains why Syrup 2 is the artificial maple syrup and represents a synthetic material?

Mount Lyell and the Lyell Glacier
The photographs below show the Lyell Glacier in 1901 and in 2011.The Lyell Glacier is located in the Sierra Nevada mountains of California within Yosemite National Park. Glaciers are sensitive indicators of climatic changes.
Which process in the cycling of water is responsible for the change in size of the Lyell Glacier?

Mount Lyell and the Lyell Glacier
The photographs below show the Lyell Glacier in 1901 and in 2011.The Lyell Glacier is located in the Sierra Nevada mountains of California within Yosemite National Park. Glaciers are sensitive indicators of climatic changes.
A student makes a claim that the Lyell Glacier changed in size between 1901 and 2011 because there was a rise in global temperatures. Which question, when investigated, includes a factor that caused the initial rise in global temperatures?

Mount Lyell and the Lyell Glacier
The photographs below show the Lyell Glacier in 1901 and in 2011.The Lyell Glacier is located in the Sierra Nevada mountains of California within Yosemite National Park. Glaciers are sensitive indicators of climatic changes.
How does the difference in heating between glacial ice and exposed land surfaces affect the size of the Lyell Glacier and the local climate?

The graphs below show some information about the Lyell Glacier and about changing global sea level from 1900 to 2020.
Which graph indicates:
• how changes in glacial surface area affect global sea level
• one action that would best mitigate this effect if the patterns in Graphs 1 and 2 continue

The Lake Erie Ecosystem
New York State borders Lake Ontario and Lake Erie. Lake Erie is the shallowest and warmest of the Great Lakes. Due to its habitat diversity, Lake Erie supports more fish species than any other Great Lake. Both native and invasive fish species are found here. Some native fish species have been severely impacted due to pollution, habitat degradation, invasive species, and overfishing.
The model below represents a food web.
Which pair of organisms in Lake Erie display a competitive relationship?

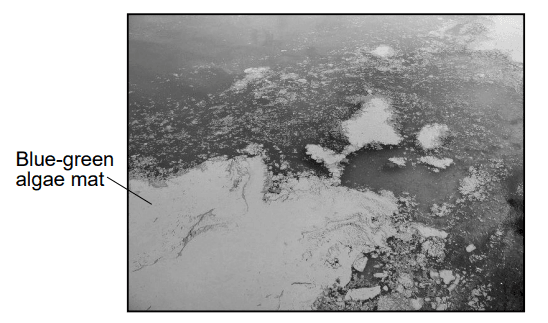
Lake Erie has been negatively affected by algal blooms during periods of warmer weather. These blooms consist of excessive growth of cyanobacteria (blue-green algae phytoplankton), which are capable of producing toxins that pose a risk to human and animal health. The overgrowth of this algae creates thick mats on the lake’s surface (algal bloom) that block sunlight from reaching underwater plants. The photo below shows an algal bloom occurring.
Which argument correctly describes how an algal bloom could affect populations of organisms in Lake Erie?
Harmful algal blooms are caused by increases of phosphorus levels in the lake. Heavy spring rains lead to greater runoff of phosphorus from farm fields. About 85% of the phosphorous comes from agriculture. Other contributing sources of phosphorous runoff include septic tanks, lawns, golf courses, and wastewater treatment plants. Graph 1 below shows some information about phosphorus in Lake Erie.
Which statement describes the predictability of phosphorous levels in Lake Erie, based on the information in Graph 1?

The Lake Erie Watershed is the most human-populated watershed in the Great Lakes region. The water from the watershed is widely used for agriculture and industry. Resources from this area meet the agricultural needs of large regions for Ohio, Pennsylvania, and New York.
The table below compares the amount of water withdrawn from surface or groundwater for different uses from the Lake Erie Watershed, in millions of gallons per day (Mgal/day).
Which argument best describes a possible relationship between water consumption and its impact on a Lake Erie ecosystem between 2012 and 2015?

Observing Jupiter
Although Galileo Galilei did not invent the telescope, he made significant advancements and refinements to the telescope in 1609. This refined telescope allowed Galileo to make observations of Earth’s Moon and the four largest moons that orbit Jupiter. Presently, spacecraft and space telescopes are used to make more detailed observations of our solar system.
Some data about Jupiter’s four largest moons are shown below in Data Table 1.
The scale model represents the mean distance between Earth and Earth’s Moon. The dots in the model represent the positions of celestial objects.
Which model best represents the mean distance between Jupiter and Europa, if drawn at the same scale as the Earth-Moon model?

Observing Jupiter
Although Galileo Galilei did not invent the telescope, he made significant advancements and refinements to the telescope in 1609. This refined telescope allowed Galileo to make observations of Earth’s Moon and the four largest moons that orbit Jupiter. Presently, spacecraft and space telescopes are used to make more detailed observations of our solar system.
Some data about Jupiter’s four largest moons are shown below in Data Table 1.
Which of the following lists the moons from Data Table 1 and Data Table 2 in order from largest mass to smallest mass?

Many planets in our solar system have moons. The gravitational interaction between a planet and its moon keeps the moon in a relatively constant orbit around the planet.
Data Table 3 below shows some information about Jupiter and Saturn.
Which argument explains why Enceladus experiences a weaker gravitational force than Io from the planet it orbits, even though Enceladus is closer to its planet?

The model below represents some information about Io and Jupiter.
A student claims that the Sun exerts a gravitational force on Jupiter, but not on Io.
Do you support or refute this claim and why?

In 2023, the Jupiter Icy Moons Explorer (JUICE) spacecraft was launched to investigate Jupiter and three of its moons. This mission will begin collecting data in 2031 and is expected to last eight years. It will focus on learning more about each moon’s environment, as well as their potential for supporting life, as it passes by them.
When planning and building JUICE, scientists needed to meet the mission’s objectives and consider both criteria and constraints. The objectives for the mission are listed below.
• Collect data on the ocean-bearing icy moons of Callisto, Europa, and Ganymede.
• Determine if there is water beneath the surface of the moons.
• Study the magnetic fi elds of Ganymede and Callisto.
• Map the topographic surface of Jupiter’s moons.
• Investigate the upper layers of Ganymede’s and Callisto’s atmospheres.
• Search for evidence of potentially habitable environments on Jupiter.
In order to successfully meet their objectives, scientists planning and building the JUICE spacecraft mission had to address the
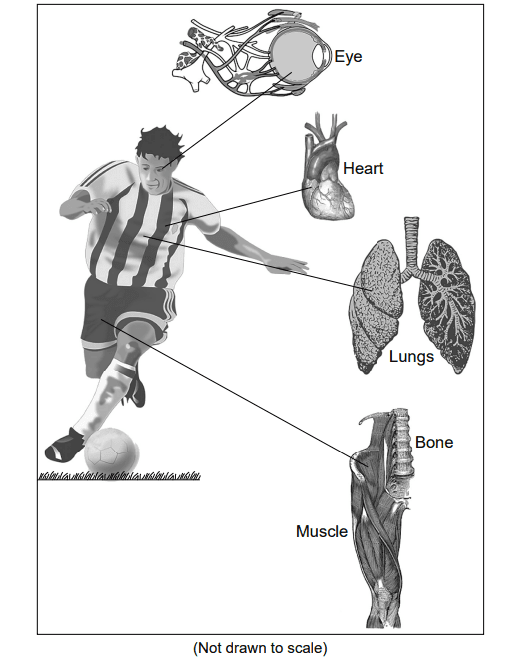
Organ Systems and Responses
On the field, a soccer player responds to stimuli in various ways. Coordinated responses are a result of the player’s body systems working together. These responses are intended to help the body maintain homeostasis or are learned behaviors performed by the player.
The player’s coach always encourages all participants to work together as a team. The player claims that the human body works similarly because the body consists of interacting systems. Which piece of evidence supports this claim?
In soccer, when a shot is taken, the goalie from the opposing team tries to catch or block the shot in order to prevent the other team from scoring. This action involves a series of coordinated responses in the goalie’s body.
Place the lettered items below in the correct sequence to model how this information is processed by the goalie.

The model below represents the transport of gases within a muscle cell in a soccer player’s body. Structures labeled X are organelles within the muscle cell.
From the table below, which row correctly matches the name and function of the organelles labeled X?

The model below identifies the chemical formulas of some molecules in the cells of a soccer player. One molecule is missing.
Which molecule is missing from the “Production of Energy Model,” and which body system provides it?

While playing soccer, athletes often experience changes in body temperature. The model below represents the different ways the human body responds to changes in body temperature to maintain homeostasis.
Which row correctly pairs a sensory organ and the body’s response to increased activity while playing soccer?

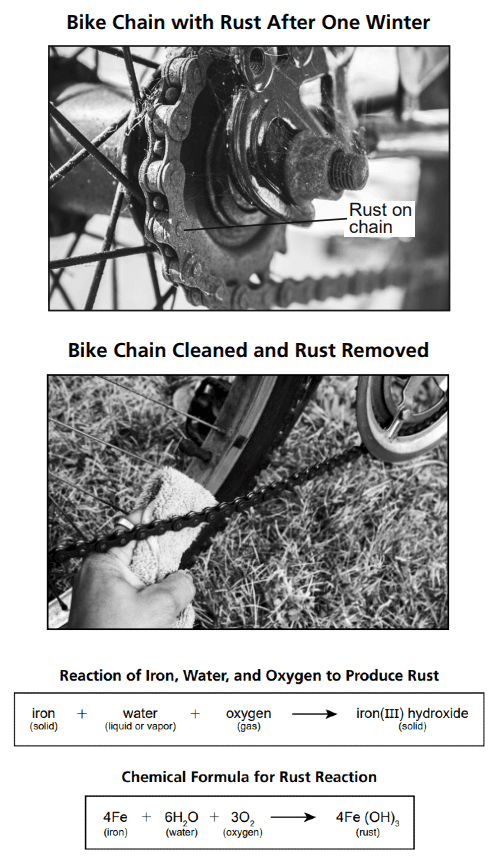
Rust
A student in New York State left their bicycle outside all winter in the rain and the snow. When they went to ride it on a spring day, they noticed the bike chain was rusted. It took some time to remove the rust.
The student decided to conduct research to find out how the rust formed and what they could do to prevent their bike chain from getting rusty again next winter. Through research, the student found out that bike chains are made of steel, which is made of 99% iron. Therefore, they decided to use steel nails to test for causes of and solutions to the rusting problem.
Rust is produced when iron reacts with oxygen and water. The chemical formula for the reaction is shown below.
Given this reaction, which statement correctly identifies the properties of the substances that are different before and after this reaction has taken place?
Which table shows the total number of atoms in the reactants and the total number of atoms in the products for the chemical reaction?
The student conducted three experiments in order to test if water and oxygen in the environment rust steel nails. They used appropriate safety equipment and followed all safety procedures. Three separate steel nails were placed in separate test tubes, each containing different substances. All three test tubes were sealed with stoppers.
• In test tube 1, the nail was partially placed in water.
• In test tube 2, the nail was submerged in water that was boiled to remove oxygen and a layer of oil was added to prevent oxygen from re-entering the water.
• In test tube 3, the nail was enclosed in air and a chemical (anhydrous calcium chloride) that removes water vapor from the air was added.
The nails were left in the test tubes for approximately three weeks. A model representation of the experiment is shown below.
The results of the three experiments are shown in the table below.
Use the information from the chemical reaction to explain why rust formed (or did not form) in one of the test tubes. Which explanation best supports the observed result? Select THREE answers.

The student, located in New York State, wants to have a shed built on the back of their house to protect the bicycle from future weather conditions. The criteria for the shed materials are:
• pressure-treated lumber
• not affected by cold, snowy winters
• reasonably priced
• quality materials that do not rust
The builder, whose priority is to build a safe, durable shed that will last, must decide what materials and nails to use in the construction of the shed.
Which statement best explains why one of the designs meets all of the criteria and is the best choice for the shed materials?

Earth’s Tectonic Plates
Geoscience processes have changed features on Earth’s surface throughout Earth’s history. Mt. Everest is one surface feature that directly formed when the Indian subcontinent collided with the Eurasian Plate. Diagram 1 models the inferred rate of movement of the Indian subcontinent over the last 71 million years. Diagram 2 shows the current location of the Himalayan mountains and Mt. Everest relative to the Indian subcontinent and the Eurasian Plate.
Select the two statements that support the claim:
The Indian subcontinent collided with the Eurasian Plate.

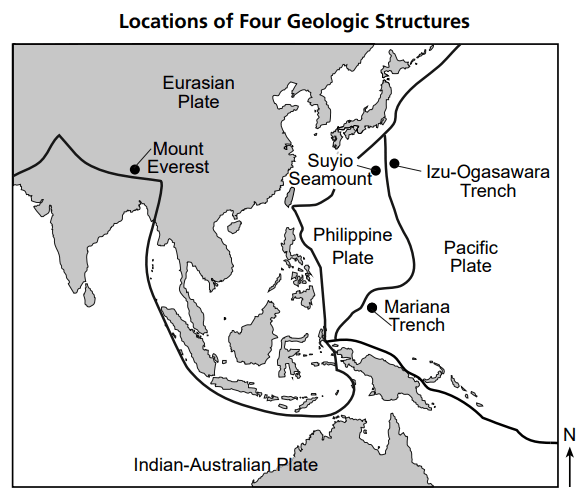
The map below shows information about some tectonic plates and their interactions. A seamount is a structure that forms under the ocean. The lines on the map represent plate boundaries.
Based on evidence from the map, it can be inferred that
The map below shows some information about the bedrock below the Atlantic Ocean. The dark line that runs down the center of the ocean floor bedrock is a boundary between two tectonic plates.
The evidence in the map that supports the idea that Earth’s plates are spreading apart at the boundary is that the age of the ocean floor bedrock

The map below shows some information about the bedrock below the Atlantic Ocean. The dark line that runs down the center of the ocean floor bedrock is a boundary between two tectonic plates.
How the shapes of the continents shown in the Ages of Atlantic Ocean Floor Surface map are evidence for past plate motion? Select TWO answers.

Sickle Cell Anemia
Sickle cell anemia is a genetic disease that causes severe symptoms in humans. People with sickle cell anemia do not have enough normal red blood cells to carry oxygen to body cells. The disease is caused by a mutation of a gene that makes hemoglobin. Hemoglobin is the protein that carries oxygen in red blood cells. Normal hemoglobin and hemoglobin in sickled red blood cells look different. The mutation in the gene slightly changes the shape of the hemoglobin molecule which also changes the shape of the red blood cell.
Model 1 represents a change in the genetic material caused by a mutation in the gene that makes hemoglobin.
Based on Model 1, where does the mutation occur in the gene, and how does it affect a person with sickle cell anemia?
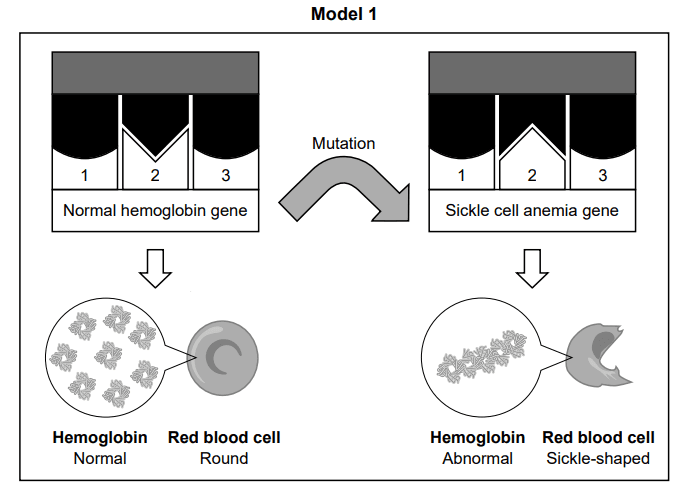
Sickle Cell Anemia
Sickle cell anemia is a genetic disease that causes severe symptoms in humans. People with sickle cell anemia do not have enough normal red blood cells to carry oxygen to body cells. The disease is caused by a mutation of a gene that makes hemoglobin. Hemoglobin is the protein that carries oxygen in red blood cells. Normal hemoglobin and hemoglobin in sickled red blood cells look different. The mutation in the gene slightly changes the shape of the hemoglobin molecule which also changes the shape of the red blood cell.
Model 1 represents a change in the genetic material caused by a mutation in the gene that makes hemoglobin.
How does the mutation shown in Model 1 affect the hemoglobin molecule and the red blood cell shape?

The model below represents the potential genetic outcomes for offspring of two parents. Each parent carries one allele for normal red blood cell production (H) and one allele for sickle-shaped red blood cell production (h). A carrier is an individual who has only one allele associated with a disease and who does not usually show symptoms of this disease.
Which statement is generally true for an individual who inherits the mutated sickle cell anemia gene from only one parent?

The model below represents the potential genetic outcomes for offspring of two parents. Each parent carries one allele for normal red blood cell production (H) and one allele for sickle-shaped red blood cell production (h). A carrier is an individual who has only one allele associated with a disease and who does not usually show symptoms of this disease.
Part A: Which Punnett square model determines the genetic probabilities of the offspring of a mother who is a carrier of the sickle cell gene and a father who is nota carrier, but has normal hemoglobin?

Part B: Based on the Punnett square model as evidence, how does the presence of sickle cell anemia in the offspring compares to the presence of sickle cell anemia in the parents?

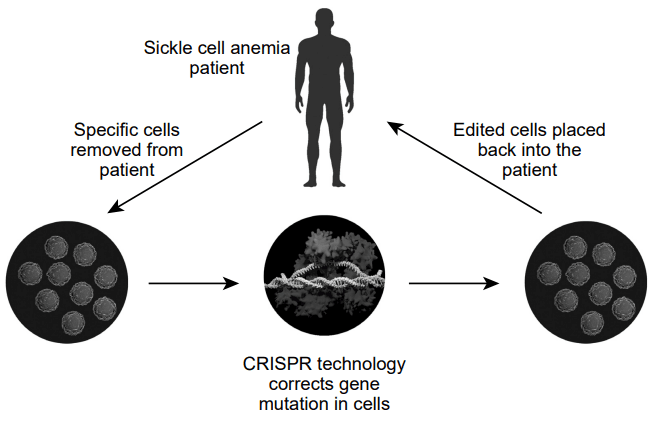
Sickle cell anemia can be treated using a process called CRISPR mediated gene therapy. This technology involves removing specific cells from a patient. The mutated genes in these cells are corrected and the newly edited cells are placed back into the patient’s body to start making new normal blood cells.
Which statement about the function of cell parts accurately describes how CRISPR technology influences the traits of humans who have sickle cell anemia?
Practical Applications of Magnetism
A team of students investigated factors that affect the strength of magnets and electromagnets. In addition, this team studied how magnetic forces can be used in practical applications. The team used appropriate safety equipment and followed all safety procedures as they worked.
The team determined the number of steel washers that a neodymium magnet could pick up when the magnet was kept at five different temperatures.
Which appropriate question the team could ask to determine if a variable represented in the graph affects the strength of this magnetic force?

The team then investigated factors that affected the strength of the magnetic force exerted by an electromagnet. The model of the experimental setup and data taken are shown below. The current through the electromagnet was measured in amperes (A). The electromagnet was used to lift iron fi lings from a pile on a table. The mass of the iron filings lifted was measured in grams.
The list below contains variables that can be manipulated in this investigation. Select the three variables that the team investigated in order for them to determine each variable’s effect on the strength of the magnetic force exerted by the electromagnet.

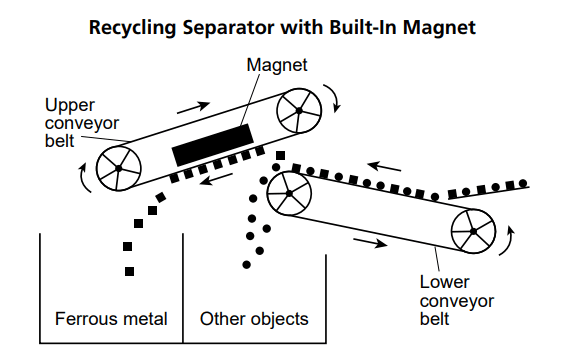
Engineers design recycling plants that use magnetic forces to sort metals like steel and iron from plastics, paper, and glass. The team of students investigated the recycling process that the engineers designed and developed.
Their model below represents a built-in magnet separator used in recycling. The separator is composed of two conveyor belt mechanisms. Ferrous metal (containing iron), glass, plastics, and paper travel on a lower conveyor belt in the direction shown. Ferrous metal is attracted toa magnet located inside the upper conveyor belt mechanism and travels in the direction shown. The various objects eventually fall into separate containers below.
Which statement provides evidence that the objects that need to be sorted are in a magnetic fi eld created by the magnet located inside the upper conveyor belt mechanism?
Electromagnets are used to lift and move magnetic metals in recycling facilities. These metals may be sharp and very heavy, but with the use of an electromagnetic crane, the metal can be moved safely and easily. The team of students investigated the types of objects that were able to be lifted by the electromagnetic crane.
The team of students observed that the crane was able to lift the car. When the electromagnet was placed on the more massive bus, the crane was not able to lift it. Which argument is supported by this evidence?

Electromagnets are used to lift and move magnetic metals in recycling facilities. These metals may be sharp and very heavy, but with the use of an electromagnetic crane, the metal can be moved safely and easily. The team of students investigated the types of objects that were able to be lifted by the electromagnetic crane.
The team of students claimed that the electromagnetic crane has done work on the car because they observed that the car was lifted from Earth’s surface to the position shown in the model. Which argument about the energy of the Earth-car system best supports this claim?

Part A:
Identify the type of reproduction exhibited by guppies.

Part B:
Which model correctly shows the number of chromosomes within each of the three guppy cells during reproduction?

Which statement implies an evolutionary relationship by providing evidence of anatomical similarities and differences between aquarium guppies and guppies in their natural habitat?

Part A:
A population of guppies was transferred from their natural environment into a large aquarium. Which graph below shows the relationship between the percent of male guppies in this population with a specific variation of a trait over time? Identify the variation of the specific trait of male guppies that increased overtime and the variation that decreased over time.
Part B:
How did natural selection influence the increase or decrease of both variations of the trait over time?

Two predators of guppies are cichlids and rivulus. Cichlids feed on adult guppies. Rivulus eat only young guppies before the guppies develop spots.
In another investigation, ponds under three different sets of conditions were used to raise guppies. In the first pond, guppies existed without any predators. After six months, one-third of the guppies were transferred to a pond with cichlids and one-third were transferred to a pond with rivulus. The remaining guppies were left in the first pond.
Graph 1 below represents the average number of spots on male guppies at 0, 6, 10, and 20 months of this investigation.
Based on the trend shown in Graph 1, what is the most likely appearance of the guppy population in the cichlid pond at month 25?

Guppies are known to be very tolerant of and adaptable to new environments, and able to consume multiple food sources, including mosquito larvae. As a result, guppies have been frequently introduced into established ecosystems to control mosquito populations. Guppies are now found worldwide. Due to the increasing need for mosquito-borne disease control, guppy relocation will likely continue. Mosquito control is an issue in Malaysia. Population control methods for mosquitos include:
• cleaning up mosquito breeding areas by draining standing water
• using guppy fishes to eat mosquito larvae
• using ABATL (mosquito larvae insecticide) which is deadly to mosquito larvae
• fogging which uses an airborne insecticide to kill adult mosquitos
Given these solutions for controlling mosquito populations in Malaysia, which statement describes the best solution that maintains biodiversity in the ecosystem?
Energies of Dropped Marbles
Students investigated the relationship between speed and kinetic energy by dropping a glass marble (mass = 18.5 g) into a cup of flour. The depth of the marble in the flour is a measure of the kinetic energy of the marble upon impact. Four different drop heights (12.5 cm, 25 cm, 50 cm, and 100 cm) were investigated. The speed of the marble at impact was calculated for each of these heights. The data table below shows some data collected during this experiment.
What was the dependent variable in this investigation?


Which evidence from the data table best supports the claim that when work is done on or by the marble, the marble’s energy changes as energy is transferred to or from it?

Students repeated the same investigation using a drop height of 50 cm, but used a glass marble with a mass of 37.0 g instead of 18.5 g. The speed on impact remained 3.1 m/s. How does the kinetic energy of the heavier marble compare to the original?

Before each marble was dropped, the amount of potential energy the marble had was the greatest at
