Loading...
PISA 2025- Reading (1)
Quiz by Mary Joy D. Albalate
Tag the questions with any skills you have. Your dashboard will track each student's mastery of each skill.
What is the depth of Lake Chad today?
A. About two metres.
B. About fifteen metres.
D. It has disappeared completely.
E. The information is not provided.
C. About fifty metres.
In about which year does the graph in Figure 1 start?

A. 8 000 BC
D. 10 000 BC
E. 20 000 BC
B. 9 000 BC
C. 11 000 BC
What is the depth of Lake Chad today?

In about which year does the graph in Figure 1 start?

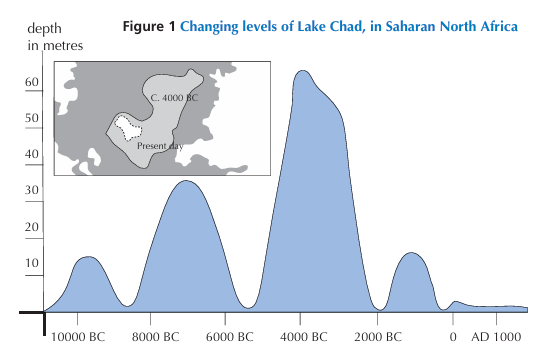
Figure 1 shows changing levels of Lake Chad, in Saharan North Africa. Lake Chad disappeared completely in about 20,000 BC, during the last Ice Age. In about 11,000 BC it reappeared. Today, its level is about the same as it was in AD1000
Why has the author chosen to start the graph at this point? ____________

Figure 2 is based on the assumption that __________________________.

For this question you need to draw together information from Figure 1 and Figure 2. The disappearance of the rhinoceros, hippopotamus and aurochs from Saharan rock art happened
Environmental Problems
Before humans came on the scene, the world changed slowly. There were for natural calamities such as earthquakes, volcanic eruptions, and tropical storms. The climate warmed and cooled. New plants and animals evolved and became extinct in their turn. Sea levels rose and fell over periods of thousands, if not millions of years.
But during the last two thousand years, the rate of change has been dramatic. Forests have vanished and river courses have been altered. Large areas of natural vegetation have disappeared under farmland and cities. The delicate balance of nature has been disturbed. Some of the results pose serious problems for the survival of humans.
Earth is home to millions of species, yet, one dominates it. The world witnessed many changes after humans came on the scene. The change led to a receding of:

The given figure shows how different regions of the world contributed to global warming in 1980s. Circle Yes/No if you agree or disagree with the following statement about the same.
A. European countries contributed more than Brazil, India and China put together.
The given figure shows how different regions of the world contributed to global warming in 1980s. Circle Yes/No if you agree or disagree with the following statements about the same.
B. China and Brazil together contributed more than USA alone.
The given figure shows how different regions of the world contributed to global warming in 1980s. Circle Yes/No if you agree or disagree with the following statements about the same.
C. Rest of the world contributed more than USA alone.
The given figure shows how different regions of the world contributed to global warming in 1980s. Circle Yes/No if you agree or disagree with the following statement about the same.
D. European countries and India together contributed less than rest of the world.
Ecological disturbance brings about the mortality to organisms and changes the pattern of their ecosystems. State the measures that can be taken up to minimize this ongoing imbalance in nature. _____________________
There are seven billion people inhabiting planet earth today and are together accelerating the rate of climate change. However, the pie chart shows that countries with had lesser population contributed more towards this imbalance in the year 1980. What could have been the possible reason for this? ________________________