Loading...

PISA REVIEW QUESTIONS ON HAZARDS
Quiz by DONALD AGSOY
Tag the questions with any skills you have. Your dashboard will track each student's mastery of each skill.
NUCLEAR POWER PLANT
Nuclear power plants are a critical source of energy, utilizing the process of nuclear fission to generate electricity. When uranium-235 nuclei undergo fission, they split into smaller nuclei, releasing a significant amount of energy along with neutrons.
Consider the following scenario: A nuclear power plant is designed with a cooling system that helps maintain the appropriate temperature within the reactor core. If the cooling system fails, what are the immediate scientific phenomena that can occur, and why are they dangerous?
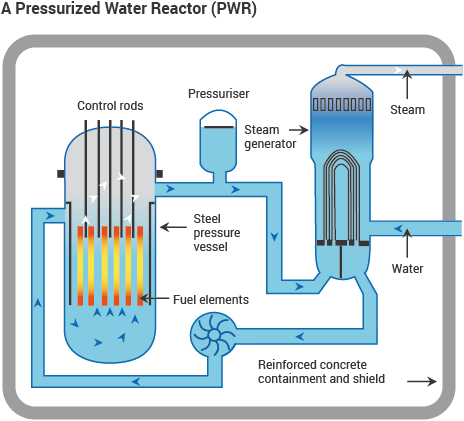
The temperature of the reactor core increases due to the continued fission reactions, which can lead to the melting of fuel rods and a potential release of radioactive materials.
The reactor core temperature decreases, allowing for more efficient energy production, ultimately improving the power output of the plant.
The fission reaction will completely stop, as the lack of cooling will cease the reaction process and render the reactor inactive.
The additional neutrons released from fission will be absorbed by the control rods, causing a decrease in fission reactions and stabilizing the reactor core.
Nuclear Power Plants
Nuclear power plants are a critical source of energy, utilizing the process of nuclear fission to generate electricity. When uranium-235 nuclei undergo fission, they split into smaller nuclei, releasing a significant amount of energy along with neutrons.
A scientist is studying the energy released during the nuclear fission of uranium-235 (235U). When a single nucleus of 235U undergoes fission, it releases approximately 200 MeV (mega-electronvolts) of energy. If 1 MeV is equivalent to 1.602×10⁻¹³ joules, how much energy is released in joules when 1 atom of Uranium-235 undergoes fission?

2.56×10⁻¹¹ J
1.60×10⁻¹⁰ J
3.21×10⁻¹³ J
3.20×10⁻¹¹ J
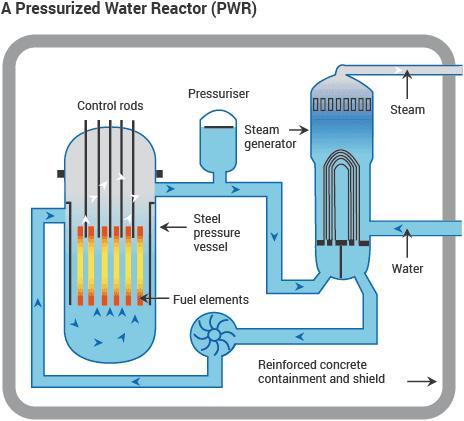
NUCLEAR POWER PLANT
Nuclear power plants are a critical source of energy, utilizing the process of nuclear fission to generate electricity. When uranium-235 nuclei undergo fission, they split into smaller nuclei, releasing a significant amount of energy along with neutrons.
Consider the following scenario: A nuclear power plant is designed with a cooling system that helps maintain the appropriate temperature within the reactor core. If the cooling system fails, what are the immediate scientific phenomena that can occur, and why are they dangerous?
Nuclear Power Plants
Nuclear power plants are a critical source of energy, utilizing the process of nuclear fission to generate electricity. When uranium-235 nuclei undergo fission, they split into smaller nuclei, releasing a significant amount of energy along with neutrons.
A scientist is studying the energy released during the nuclear fission of uranium-235 (235U). When a single nucleus of 235U undergoes fission, it releases approximately 200 MeV (mega-electronvolts) of energy. If 1 MeV is equivalent to 1.602×10⁻¹³ joules, how much energy is released in joules when 1 atom of Uranium-235 undergoes fission?

Impact of Climate Change on Local Biodiversity
A group of high school students conducted a scientific inquiry to assess the impact of climate change on local biodiversity. They chose two areas: one experiencing significant urban development and another that is more rural and has preserved green spaces. They collected data on the number of species observed in each area over a year, as well as temperature and precipitation records.
Based on the students' data collection design, which of the following statements best evaluates the strengths and weaknesses of their approach to understanding the effects of climate change on biodiversity?

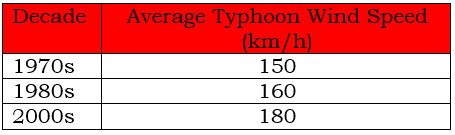
Trends in Typhoon Activity and Their Impact on the Philippines: A 50-Year Analysis
A researcher collected data on the frequency and intensity of typhoons in the Philippines over the past 50 years. The data indicates that the number of typhoons has increased, and their intensity (measured by wind speed) has escalated, particularly in the last two decades. The researcher also observed that the regions most affected by these extreme weather events are experiencing rising sea levels, which contributes to increased flooding during typhoon events.
The researcher presents the following table summarizing the average wind speed (in km/h) of typhoons in three different decades:
What can be inferred about the relationship between the change in average wind speed of typhoons and the increased frequency of severe weather events in the Philippines over the decades?
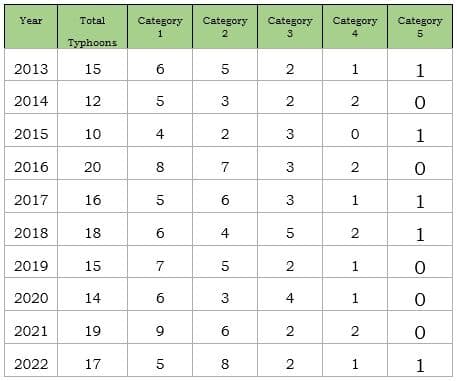
Severe Weather Trends in the Philippines: A 10-Year Analysis
A recent study evaluated the frequency and intensity of severe weather events in the Philippines over a 10-year period (2013-2022). The following table shows the number of typhoons and their categorized intensity levels (Category 1 to Category 5) during that period.
Based on the table provided, which of the following conclusions can be drawn about the trend in severe weather events in the Philippines from 2013 to 2022?
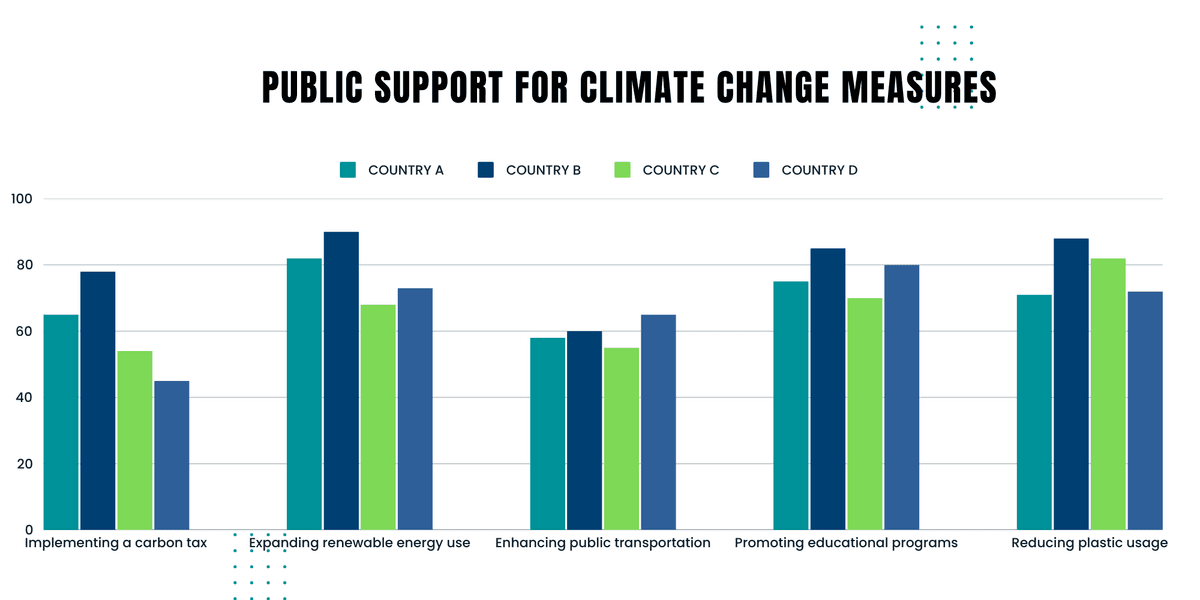
Understanding Public Support for Climate Change Initiatives
Climate change has become one of the most pressing issues globally, affecting ecosystems, human health, and economies. Governments, organizations, and individuals are continually faced with the challenge of making informed decisions to mitigate its impacts. To better understand public sentiment regarding climate change initiatives, a survey was conducted in four different countries: A, B, C, and D. The data collected is summarized in the following bargraph, which shows the percentage of respondents who support various climate change measures.
As decision-makers analyze this survey data, they must evaluate how the varying levels of public support for these climate measures might influence legislation and funding priorities. Additionally, it is essential to consider how cultural, economic, and geographic factors in each country contribute to these differences.
Basedon the data presented in the table, which of the following conclusions can bedrawn regarding the public support for climate change measures in these four countries?Select the most appropriate option and justify your choice using evidence fromthe table.
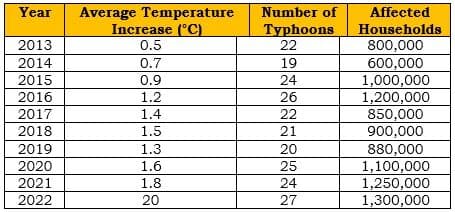
Climate Crisisin the Philippines: Rising Temperatures, Intensifying Typhoons, and TheirImpact on Communities
The Philippines is one of the countries most affected by climate change, experiencing increasing temperatures, rising sea levels, and more frequent and intense typhoons. The following table displays historical data on the average increase in temperature (°C), frequency of typhoons, and the number of affected households in different regions of the Philippines over the past decade.
As a researcher in a local environmental agency in the Philippines, you are tasked with preparing a presentation for local government officials on the impacts of climate change. You aim to inform them about the trends in temperature increase, typhoon frequency, and the corresponding rise in affected households to help them make informed decisions on disaster preparedness and response efforts.
Based on the provided data, which of the following conclusions can be drawn to guide local government actions regarding climate change?
Evaluating Energy Production Designs Based on Various Factors
In a recent scientific investigation, researchers aimed to evaluate different methods of energy production and their environmental impacts. They designed three experiments to assess the outcomes of solar, wind, and fossil fuel energy production. The researchers collected data on the amount of energy produced (in megawatts), carbon emissions (in tons), and land usage (in hectares) for each energy source over a one-month period. Below are pie charts showing their findings.
Based on this data, the researchers want to decide on the most sustainable energy production method. They will consider energy output, environmental impact (measured by carbon emissions), and land usage as key criteria.
Which choice most accurately evaluates the designs and data presented in the pie charts?

Digital Dilemmas: Unpacking the Environmental Cost of Our Connected World
In recent years, there has been increasing concern about the environmental impacts of modern communication technologies, including the internet, smartphones, and data centers. For instance, the global energy consumption of data centers alone accounted for approximately 1% of the total electricity demand in 2020, a figure projected to rise alongside the growth of cloud computing and digital services. On top of energy consumption, electronic waste (e-waste) from outdated devices also poses significant environmental challenges.
To better understand this issue, imagine a research team that has gathered information from various studies about the environmental impacts of communication technologies. They compiled data into a bar graph summarizing energy consumption and e-waste generation projected over the next decade.
Which of the following options best illustrates a potential action that could help mitigate the environmental impact of modern communication technologies based on the information presented?

Green PowerParadox: Unveiling the Hidden Environmental Costs of Renewable Energy Sources
In recent years, the global energy landscape has shifted significantly toward renewable sources. However, the production and use of these energy sources can still pose environmental hazards. Your task is to evaluate a set of renewable energy sources based on their overall environmental impact during both their production and usage phases. Below is a table summarizing the lifecycle assessment (LCA) data for three types of renewable energy: solar, wind, and bioenergy.
While evaluating the environmental hazards, consider the implications of CO2 emissions, habitat disruption, water usage, and waste generation. Analyze how these factors interact to inform decision-making regarding the adoption of these energy sources.
Based on the information provided in the table, which renewable energy source would be the most advisable option for a region aiming to minimize environmental hazards during energy production while also considering long-term sustainability and habitat preservation?
