Display and interpret data shown in tallies, tables, charts, pictographs, bar graphs, and line graphs, and use a title, appropriate scale, and labels. A grid will be provided to display data on bar graphs or line graphs.
Track each student's skills and progress in your Mastery dashboards
Give this quiz to my class
Q 1/5
Score 0
60
Q 2/5
Score 0
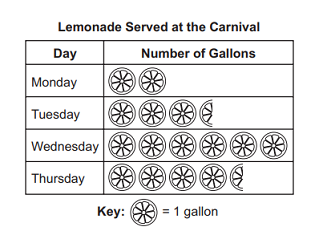
The pictograph below shows the number of GALLONS of lemonade served each day at a carnival.
How many QUARTS of lemonade were served on Thursday?
60
18 quarts
16 quarts
20 quarts
17 quarts
5 questions
Q.
1
60 sec
M05.D-M.2.1.2
Q.
The pictograph below shows the number of GALLONS of lemonade served each day at a carnival.
How many QUARTS of lemonade were served on Thursday?
2
60 sec
M05.D-M.2.1.2
Q.
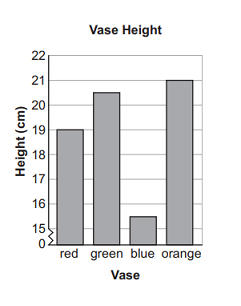
The bar graph below shows the annual rainfalls, in INCHES, of four cities.
What is the difference, in FEET, of the rainfalls of the city with the greatest rainfall and the city with the least rainfall?
3
60 sec
M05.D-M.2.1.2
Q.
Each of the students in Ms. Steven's class orders a fruit shake. The bar graph below shows the number of fruit shakes of each flavor the students order.
Which two fruit shake flavors are ordered by exactly half of the students in Ms. Steven's class?
4
60 sec
M05.D-M.2.1.2
Q.
A bar graph is shown below, but some of the information is missing.
Which title and axis labels would be MOST appropriate for the graph?