Determine whether two quantities are proportionally related (e.g., by testing for equivalent ratios in a table, graphing on a coordinate plane and observing whether the graph is a straight line through the origin).
Identify the constant of proportionality (unit rate) in tables, graphs, equations, diagrams, and verbal descriptions of proportional relationships.
Use proportional relationships to solve multi-step ratio and percent problems. Examples: simple interest, tax, markups and markdowns, gratuities and commissions, fees, percent increase and decrease.
Represent proportional relationships by equations. Example: If total cost t is proportional to the number n of items purchased at a constant price p, the relationship between the total cost and the number of items can be expressed as t = pn.
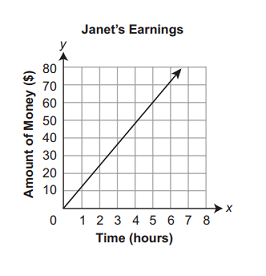
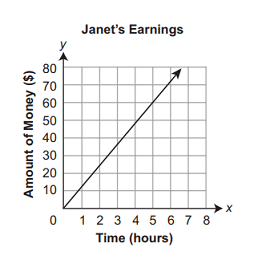
Explain what a point (x, y) on the graph of a proportional relationship means in terms of the situation, with special attention to the points (0, 0) and (1, r), where r is the unit rate.
Compute unit rates associated with ratios of fractions, including ratios of lengths, areas, and other quantities measured in like or different units. Example: If a person walks 1/2 mile in each 1/4 hour, compute the unit rate as the complex fraction 1/2 / 1/4 miles per hour, equivalently 2 miles per hour
Analyze, recognize, and represent proportional relationships and use them to solve real-world and mathematical problems.
Track each student's skills and progress in your Mastery dashboards