solve problems using qualitative and quantitative predictions and comparisons from simple experiments
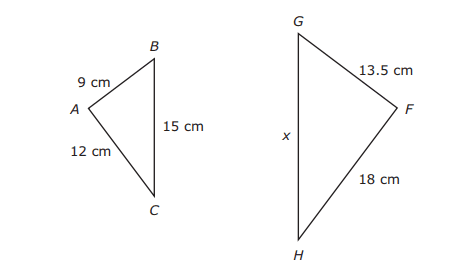
solve mathematical and real-world problems involving similar shape and scale drawings
determine if the given value(s) make(s) one-variable, two-step equations and inequalities true
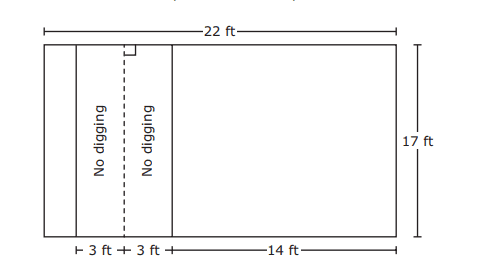
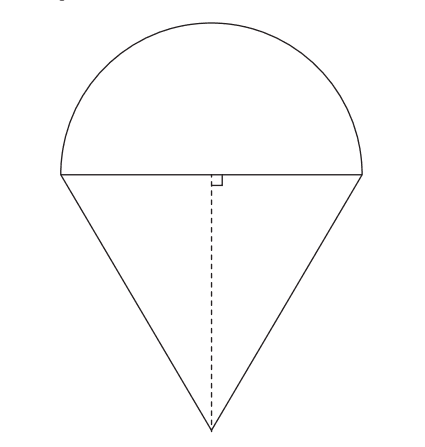
determine the area of composite figures containing combinations of rectangles, squares, parallelograms, trapezoids, triangles, semicircles, and quarter circles
apply and extend previous understandings of operations to solve problems using addition, subtraction, multiplication, and division of rational numbers
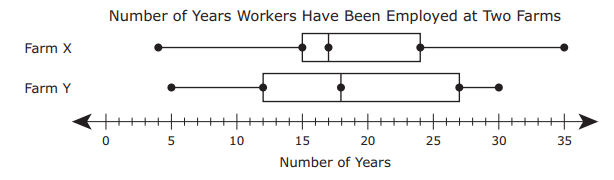
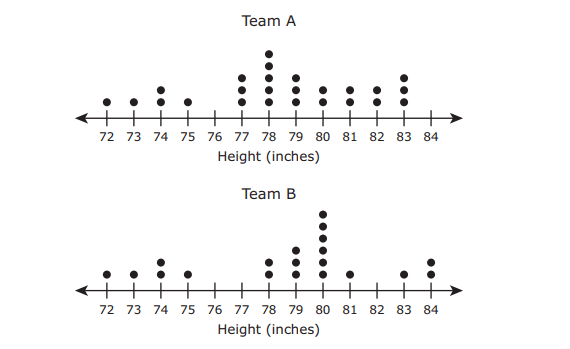
compare two groups of numeric data using comparative dot plots or box plots by comparing their shapes, centers, and spreads
write one-variable, two-step equations and inequalities to represent constraints or conditions within problems
determine the circumference and area of circles
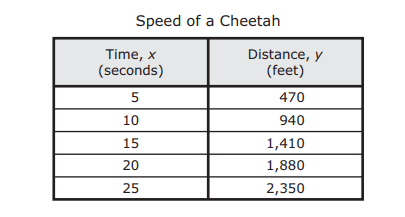
represent constant rates of change in mathematical and real-world problems given pictorial, tabular, verbal, numeric, graphical, and algebraic representations, including d = rt
convert between measurement systems, including the use of proportions and the use of unit rates
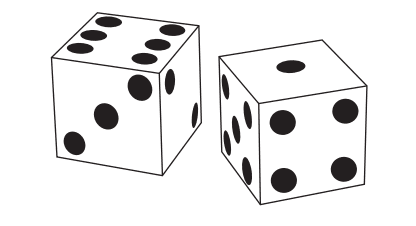
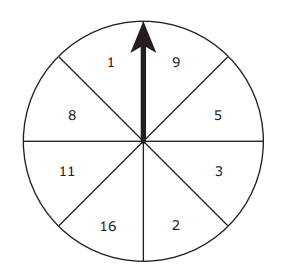
determine experimental and theoretical probabilities related to simple and compound events using data and sample spaces
solve problems involving the volume of rectangular prisms, triangular prisms, rectangular pyramids, and triangular pyramids
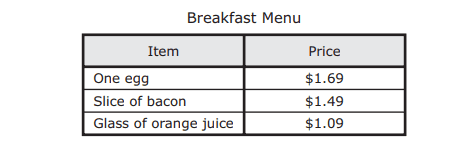
solve problems involving ratios, rates, and percents, including multi-step problems involving percent increase and percent decrease, and financial literacy problems
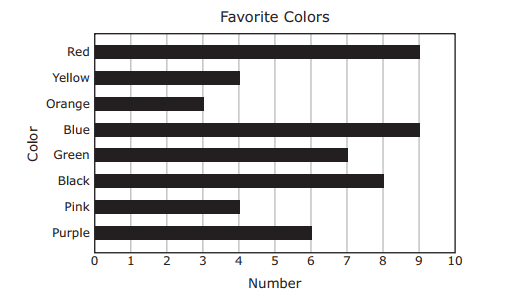
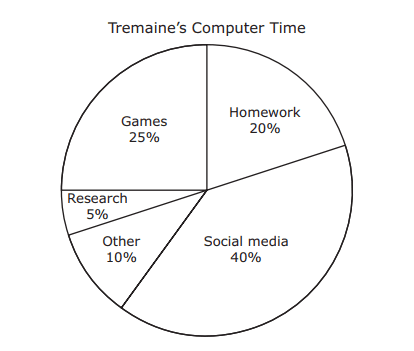
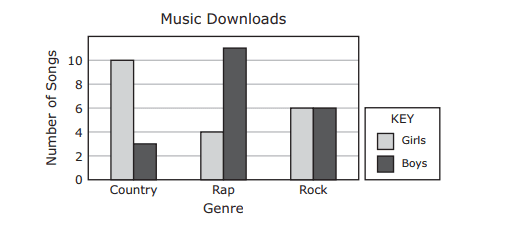
solve problems using data represented in bar graphs, dot plots, and circle graphs, including part-to-whole and part-to-part comparisons and equivalents
represent linear relationships using verbal descriptions, tables, graphs, and equations that simplify to the form y = mx + b
make predictions and determine solutions using theoretical probability for simple and compound events
model and solve one-variable, two-step equations and inequalities
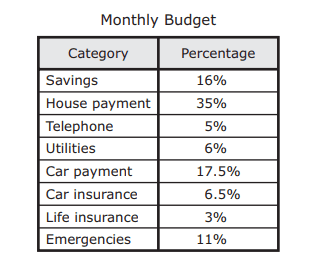
identify the components of a personal budget, including income; planned savings for college, retirement, and emergencies; taxes; and fixed and variable expenses, and calculate what percentage each category comprises of the total budget
add, subtract, multiply, and divide rational numbers fluently
write and solve equations using geometry concepts, including the sum of the angles in a triangle, and angle relationships
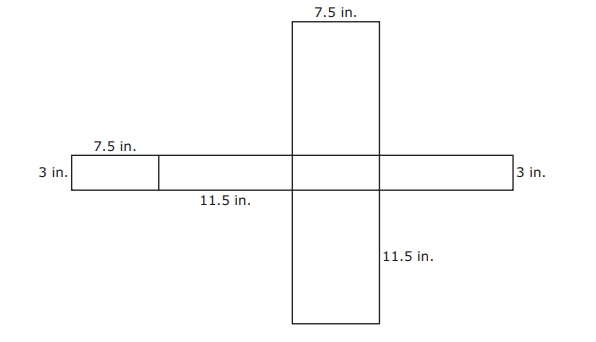
solve problems involving the lateral and total surface area of a rectangular prism, rectangular pyramid, triangular prism, and triangular pyramid by determining the area of the shape's net
make predictions and determine solutions using experimental data for simple and compound events
write a corresponding real-world problem given a one-variable, two-step equation or inequality
generalize the critical attributes of similarity, including ratios within and between similar shapes
compare two populations based on data in random samples from these populations, including informal comparative inferences about differences between the two populations
Track each student's skills and progress in your Mastery dashboards