Loading...
Statistics 2
Quiz by Chelsea Butler
Tag the questions with any skills you have. Your dashboard will track each student's mastery of each skill.
Q1
70
85
93
23
Q1
Laticia randomly selected 25% of the seventh-grade students in her school and asked them their favorite season. Of the students surveyed, 51 chose summer as their favorite season. Based on the data, what is the most reasonable prediction of the number of seventh-grade students in her school who would choose summer as their favorite season?
Consider the following samples given in the first column and select whether or not a sample is biased.
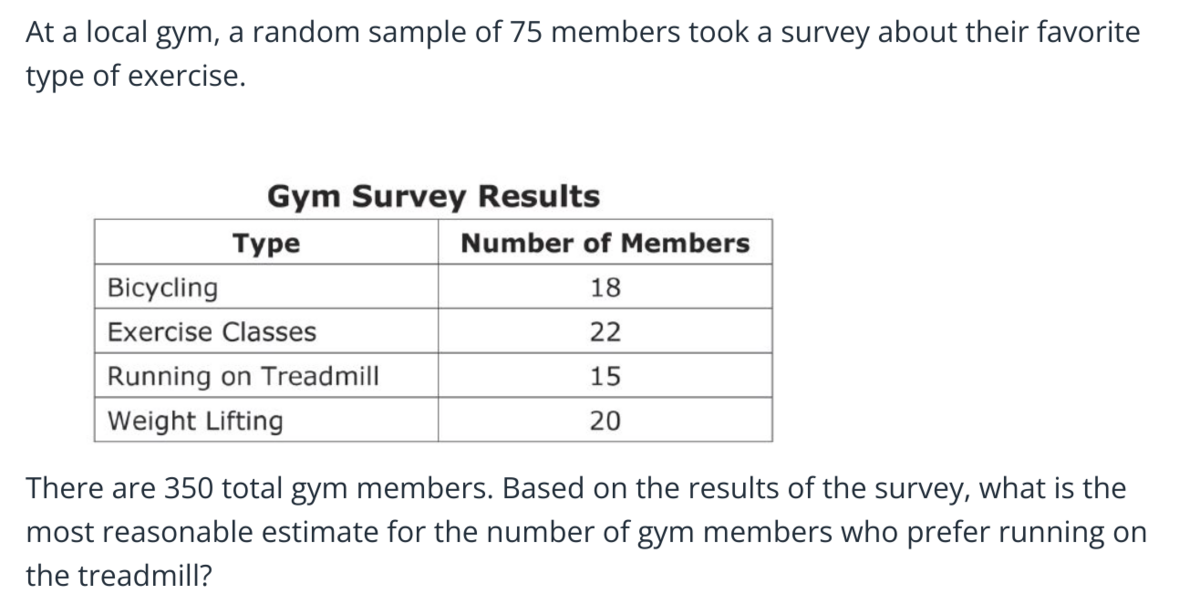
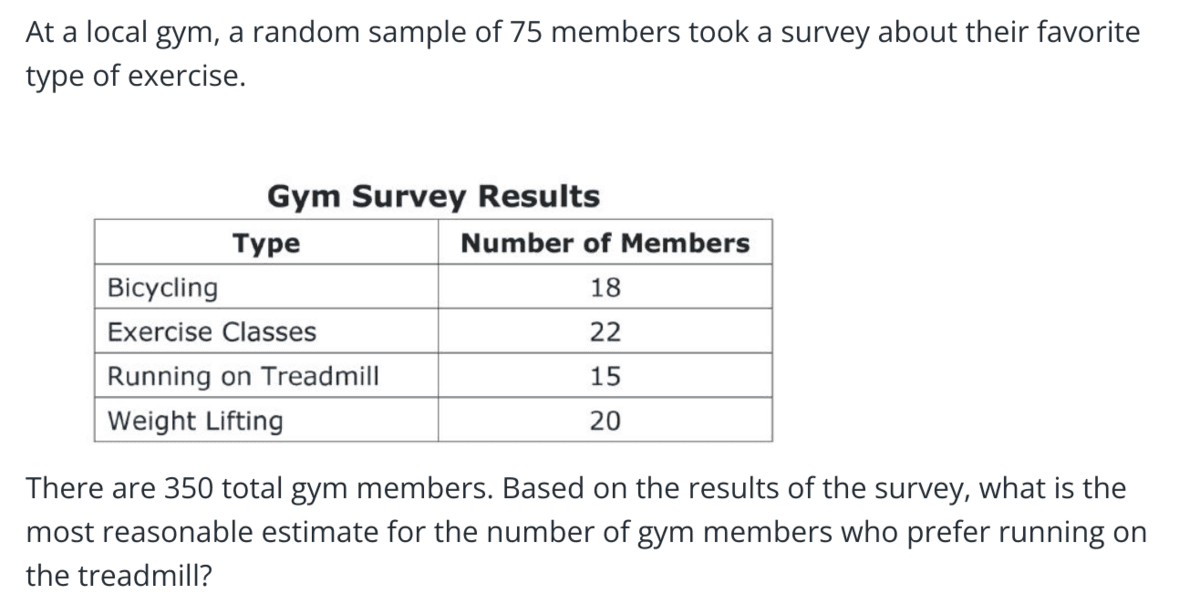
A company manufactures cell phones. In August, a random sample of 125 cell phones was inspected, and 3 phones were found to be defective. The company manufactured 8,000 cell phones in August. Based on the results from the sample, about how many cell phones are expected to be defective?
Q5
Animal Services wanted to measure the population of squirrels in a local city park. First, a team of park rangers marked 40 random squirrels in the park. Five days later, the rangers went to the park and counted a total of 450 squirrels, of which 20 were marked.
W hat is the best estimate for the squirrel population?
Ms. Andrews made the line plots below to compare the quiz scores for her first-period math class and her second-period math class. She gave the same quiz to each class.

Gabrielle surveyed a random sample of 40 students in her school's cafeteria about whether they ate the cafeteria's tomato soup.
• Fourteen of the sampled students said they ate the tomato soup.
• A total of 840840 students eat in the cafeteria each day.
Based on the results of Gabrielle's survey, how many of the 840 students who eat in the cafeteria can be expected to eat the tomato soup?
Q
