Loading...
Week 3 Quiz (9C, 8A, 9D, 2C, 3D)
Quiz by Lainey Travis
Track each student's skills and progress in your Mastery dashboards
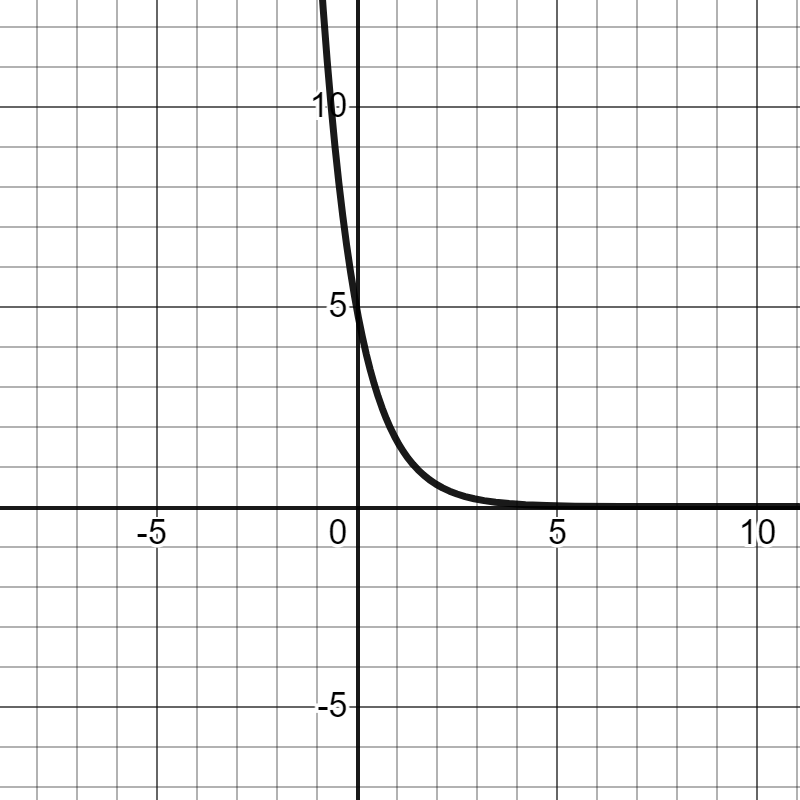
An exponential function is graphed on the grid.
Which function is best represented by the graph?
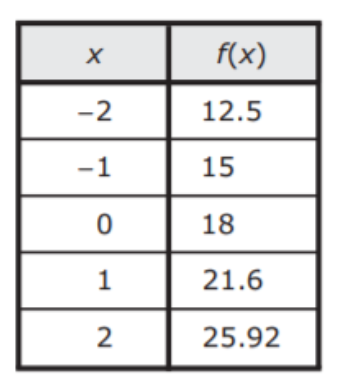
The table represents some points on the graph of an exponential function.
Which function represents the same relationship?
An exponential function is graphed on the grid.
Which function is best represented by the graph?

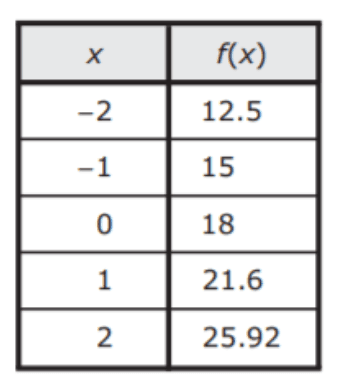
The table represents some points on the graph of an exponential function.
Which function represents the same relationship?
The table shows the amount of pet food in cups remaining in an automatic feeder as a function of the number os meals the feeder has dispersed.
Based on the table, which function models this situation?

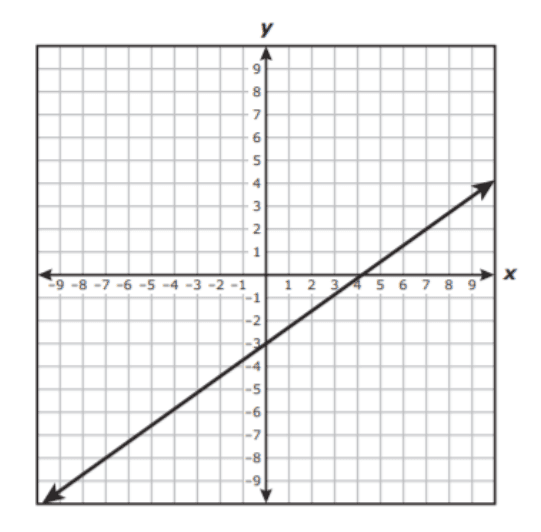
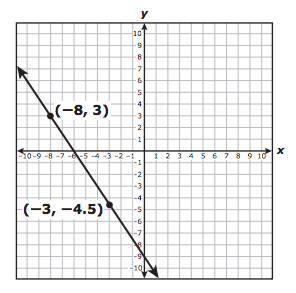
The graph of a linear function is shown on the grid.
Which equation is best represented by this graph?

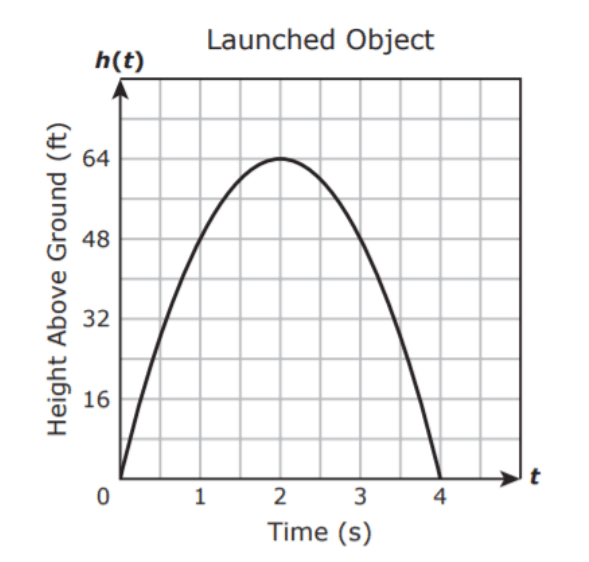
The graph shows the height in feet of an object above the ground t seconds after it was launched from the ground.
Which function is best represented by the graph of this situation?
What is the equation in slope-intercept form of the line that passes through the points (-5, 38) and (2, -11)?
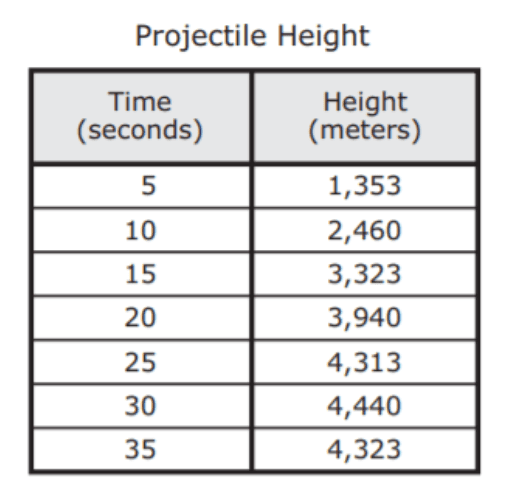
A projectile is launched into the air from the ground. The table shows the height of the projectile, h(t), at different times.
Based on the table, which function can best be used to model this situation?
A customer pays an annual membership fee of $85 to a neighborhood car wash. Each time he takes his car to the car wash, he pays only $7. The total amount of money he spends at the car wash in one year in dollars can be found using the function y = 7x + 85. What does the variable x represent in this function?
The graph of linear function g is shown on the grid. What is the zero of g?
The graph of a linear function is shown on the grid. Which equation is best represented by this graph?
