contrast bivariate sets of data that suggest a linear relationship with bivariate sets of data that do not suggest a linear relationship from a graphical representation
Track each student's skills and progress in your Mastery dashboards
Give this quiz to my class
Q 1/10
Score 0
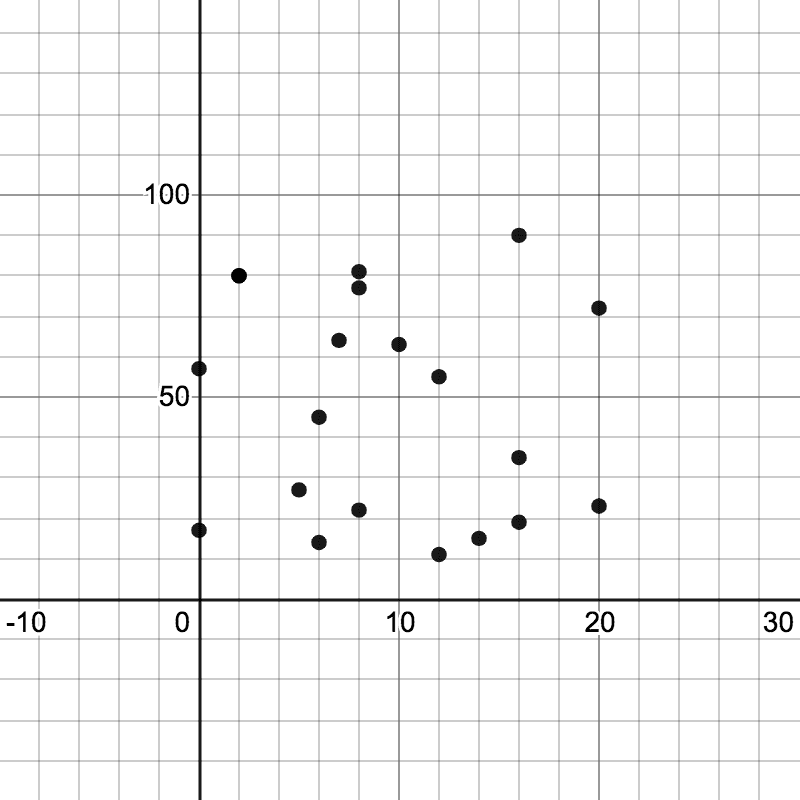
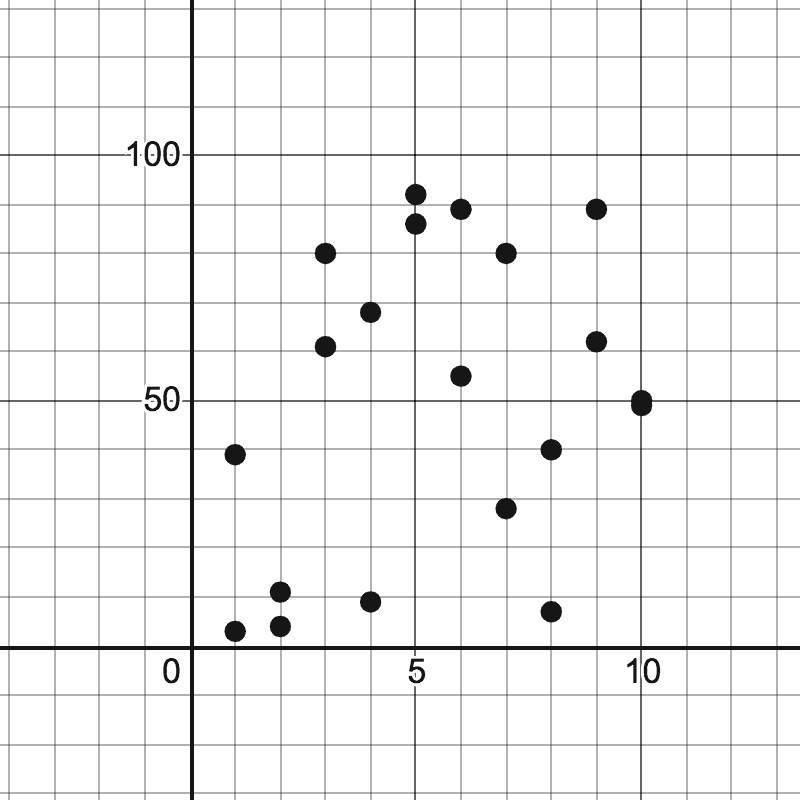
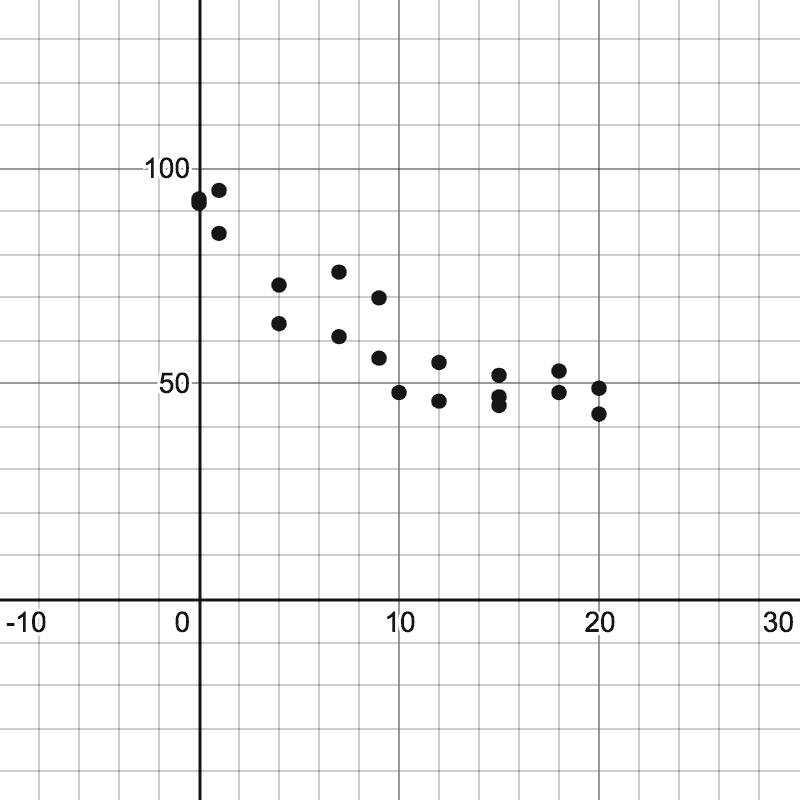
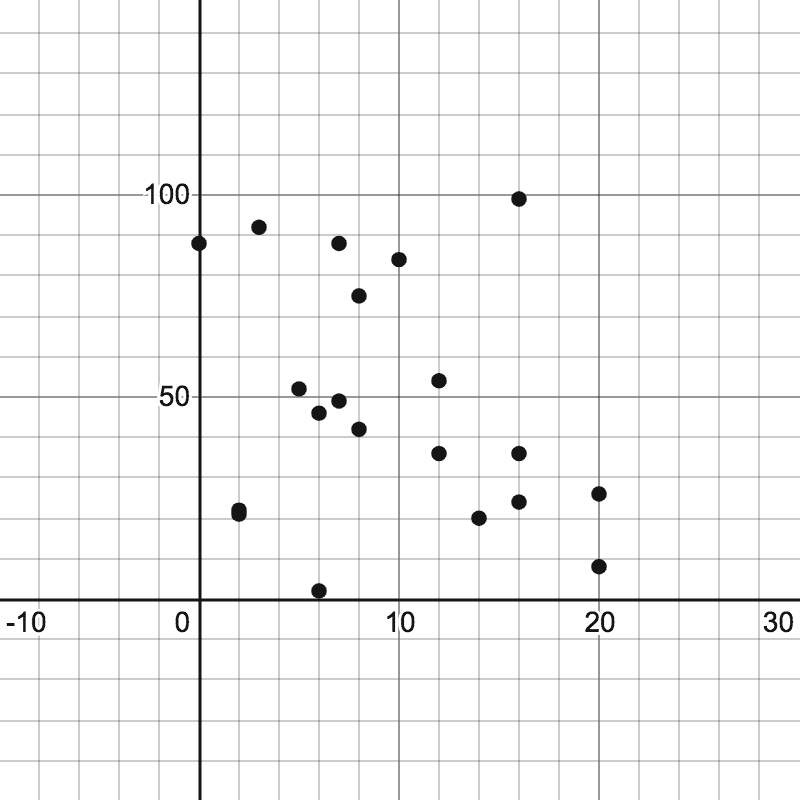
Which scatterplot suggests a linear relationship?
60
Q 2/10
Score 0
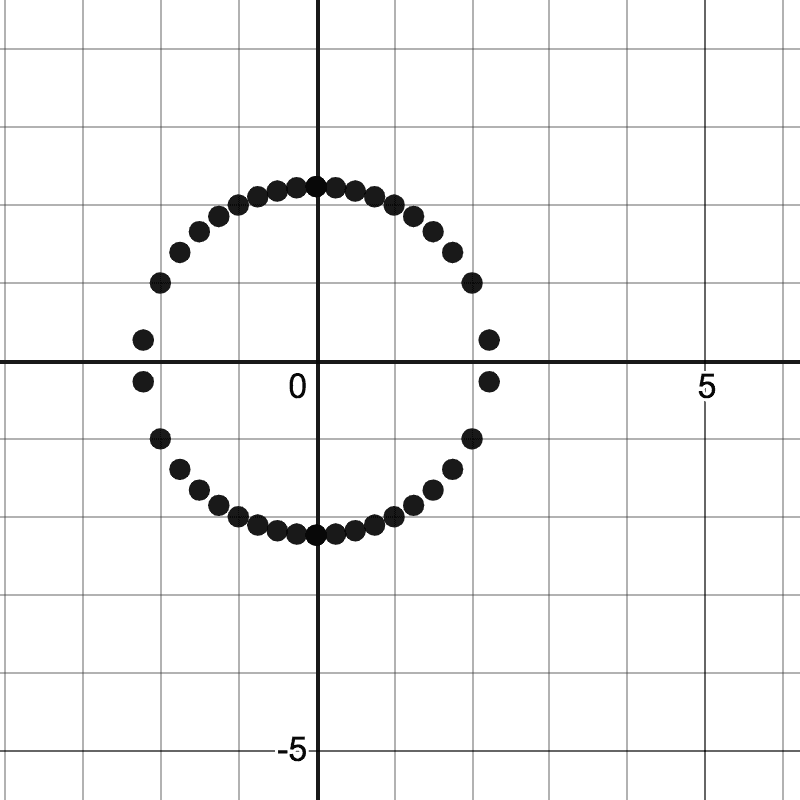
Which scatterplot suggests a linear relationship?
60
10 questions
Q.
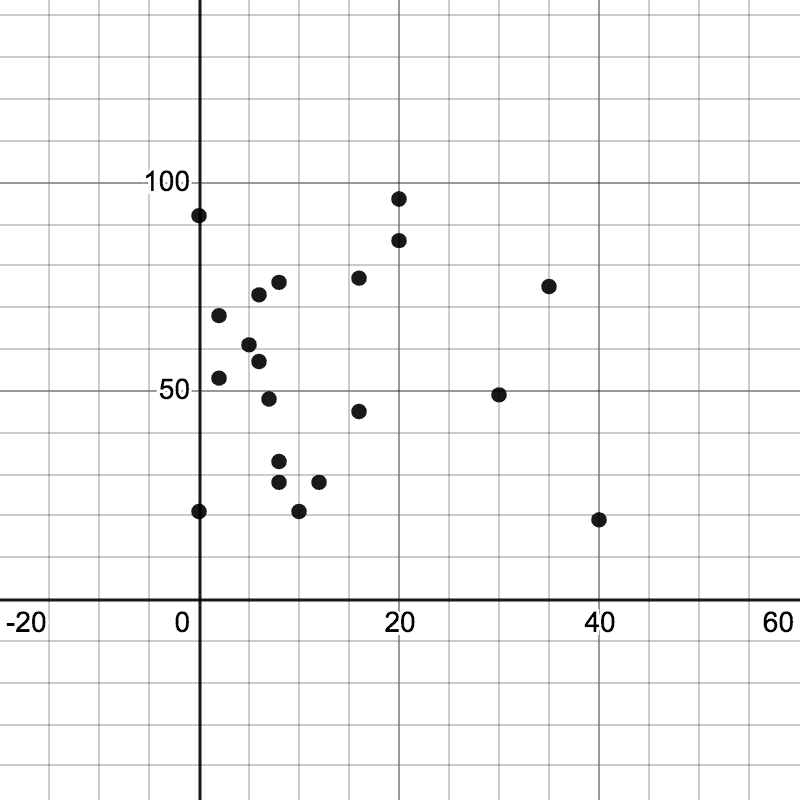
Which scatterplot suggests a linear relationship?
1
60 sec
8.5.C: Proportionality
Q.
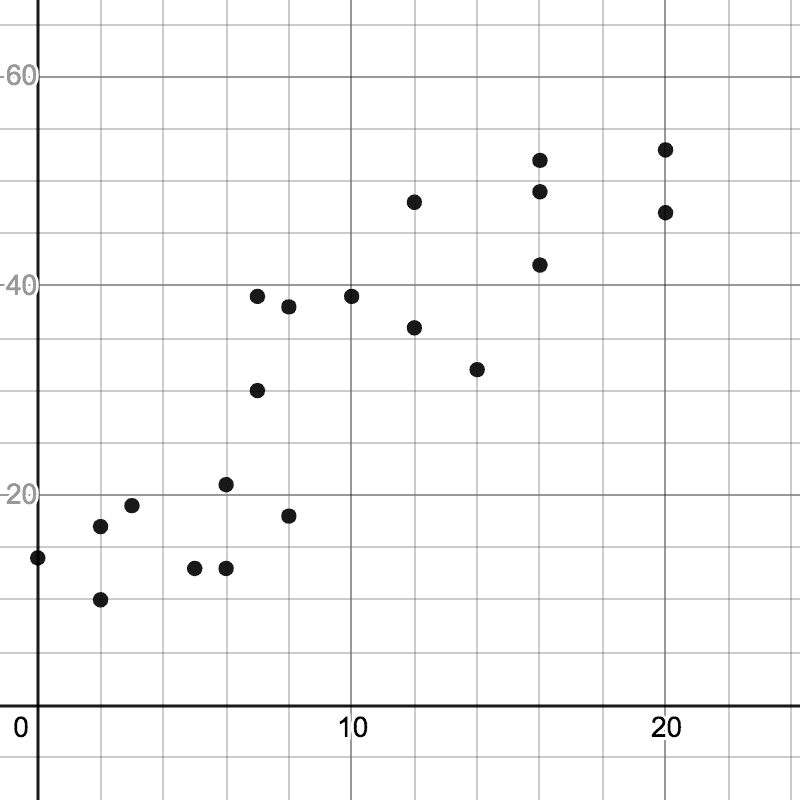
Which scatterplot suggests a linear relationship?
2
60 sec
8.5.C: Proportionality
Q.
Which scatterplot suggests a linear relationship?
3
60 sec
8.5.C: Proportionality
Q.
Which scatterplot suggests a linear relationship?
4
60 sec
8.5.C: Proportionality
Q.
Which scatterplot suggests a linear relationship?
5
60 sec
8.5.C: Proportionality
Q.
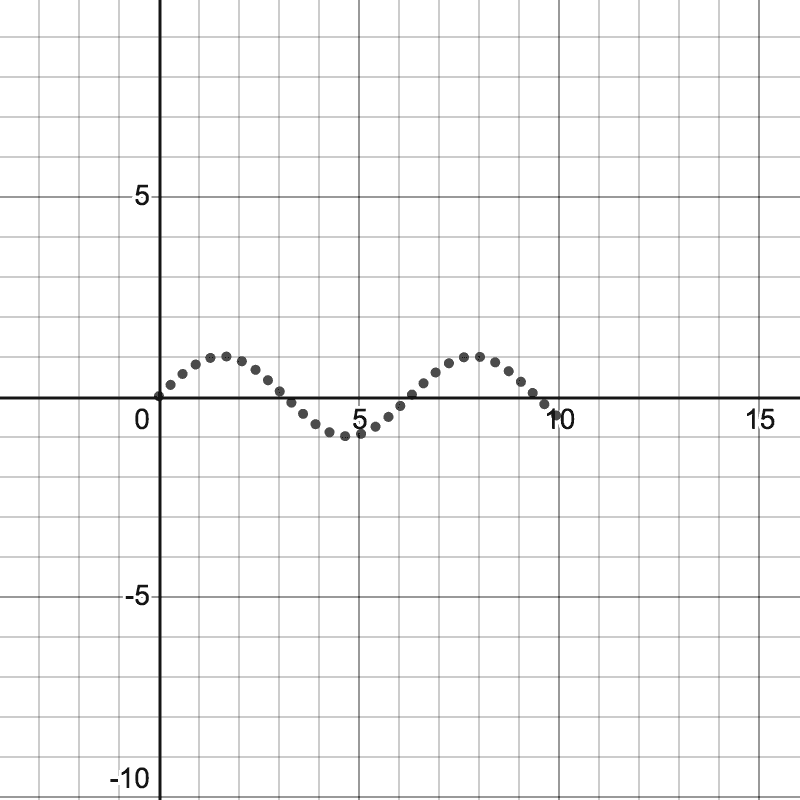
Which scatterplot suggests a non-linear relationship?
6
60 sec
8.5.C: Proportionality
Q.
Which scatterplot suggests a non-linear relationship?
7
60 sec
8.5.C: Proportionality
Q.
Which scatterplot suggests a non-linear relationship?
8
60 sec
8.5.C: Proportionality
Q.
Which scatterplot suggests a non-linear relationship?
9
60 sec
8.5.C: Proportionality
Q.
Which scatterplot suggests a non-linear relationship?