Qualitatively analyze the functional relationship between two quantities. • Analyze a graph determining where the function is increasing or decreasing; linear or nonlinear. • Sketch a graph that exhibits the qualitative features of a real-world function.
Compare properties of two linear functions each represented in a different way (algebraically, graphically, numerically in tables, or by verbal descriptions).
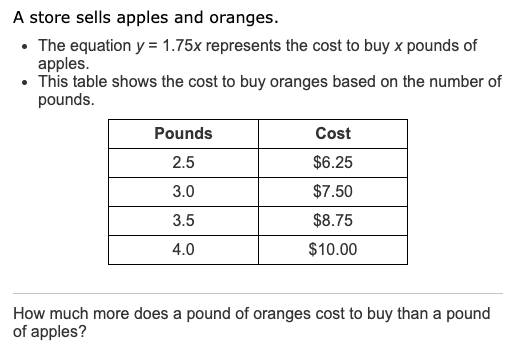
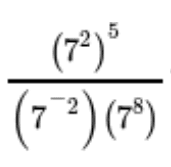
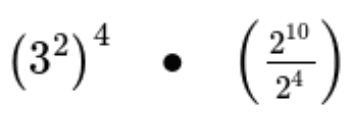
Develop and apply the properties of integer exponents to generate equivalent numerical expressions.
Track each student's skills and progress in your Mastery dashboards
Give this quiz to my class
Q 1/7
Score 0
In which choice are all four points on the same line?
30
(-7,-3) (-4,0) (0,4) (3,7)
( 2, 1) (0,0) (-1, 1) (3, 7)
( -4,4) ( -2,-2) (2, -1) (3, -2)
( -3, -6) ( -2, -3) ( 0, -4) (3, -4)
Q 2/7
Score 0
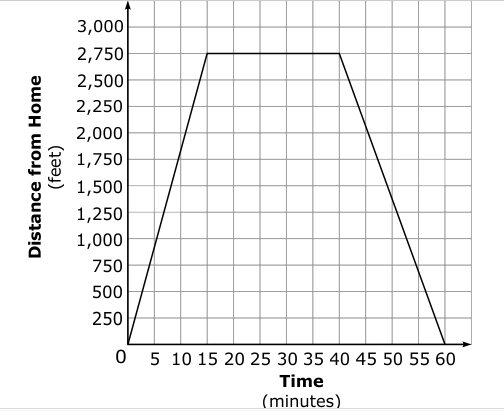
Greg walked to the store and then returned home. This graph shows the distance Greg was from his house at different times during his walk. Which statement is true?
300
Greg walked to the store at a slower rate than he walked home from the store.
Greg was at the store for 20 minutes.
Greg walked home from the store at a slower rate than he walked to the store.
Greg walked home from the store at the same rate he walked to the store.
7 questions
Q.
In which choice are all four points on the same line?
1
30 sec
NC.8.F.3
Q.
Greg walked to the store and then returned home. This graph shows the distance Greg was from his house at different times during his walk. Which statement is true?
2
300 sec
NC.8.F.5
Q.
.
3
300 sec
NC.8.F.2
Q.
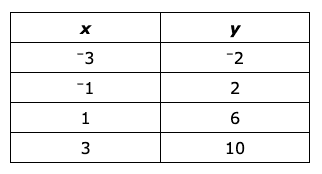
Alan compared the slope of the function y=3x+2 to the slope of the linear function that fits the values in this table. Which choice is true about the slopes of the two functions?
4
300 sec
NC.8.F.2
Q.
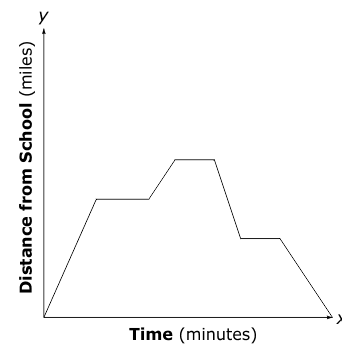
The graph below shows the distance a school bus is from school. Which best describes what the bus is doing in the flat parts of the graph?