Compare properties of two linear functions each represented in a different way (algebraically, graphically, numerically in tables, or by verbal descriptions).
Qualitatively analyze the functional relationship between two quantities. • Analyze a graph determining where the function is increasing or decreasing; linear or nonlinear. • Sketch a graph that exhibits the qualitative features of a real-world function.
Analyze functions that model linear relationships. • Understand that a linear relationship can be generalized by 𝑦 = 𝑚𝑥 + 𝑏. • Write an equation in slope-intercept form to model a linear relationship by determining the rate of change and the initial value, given at least two (𝑥, 𝑦) values or a graph. • Construct a graph of a linear relationship given an equation in slope-intercept form. • Interpret the rate of change and initial value of a linear function in terms of the situation it models, and in terms of the slope and 𝑦- intercept of its graph or a table of values.
Track each student's skills and progress in your Mastery dashboards
Give this quiz to my class
Q 1/4
Score 0
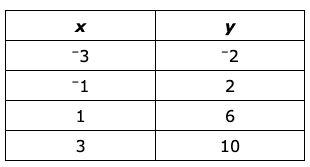
Alan compared the slope of the function y = 3x + 2 to the slope of the linear function that fits the values in this table. Which choice is true about the slopes of the two functions?
300
The slope of the graph of the table is 1 more than the slope of the graph of the equation.
The slope of the graph of the table is 2 more than the slope of the graph of the equation.
The slope of the graph of the equation is 2 more than the slope of the graph of the table.
The slope of the graph of the equation is 1 more than the slope of the graph of the table.
Q 2/4
Score 0
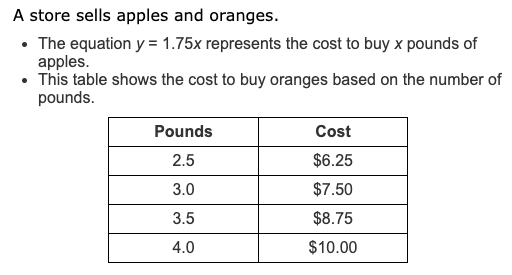
How much more does a pound of oranges cost to buy than a pound of apples?
300
$2.63
$0.75
$3.00
$1.88
4 questions
Q.
Alan compared the slope of the function y = 3x + 2 to the slope of the linear function that fits the values in this table. Which choice is true about the slopes of the two functions?
1
300 sec
NC.8.F.2
Q.
How much more does a pound of oranges cost to buy than a pound of apples?
2
300 sec
NC.8.F.2
Q.
The graph below shows the distance a school bus is from school. Which best describes what the bus is doing in the flat parts of the graph?