Loading...
2023 STAAR Test 8th Grade
Quiz by Kathleen Patterson
Tag the questions with any skills you have. Your dashboard will track each student's mastery of each skill.
The graph of a linear function is shown on the coordinate grid. What is the y-intercept?
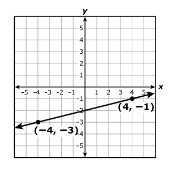
The graph of a linear function is shown on the coordinate grid. What is the slope?

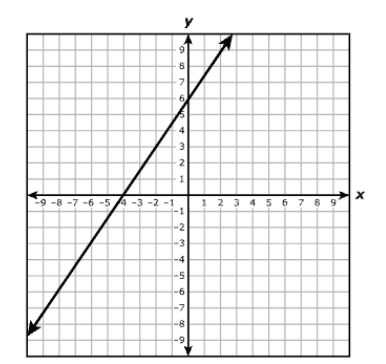
The graph of a linear function is shown on the coordinate grid. What is the y-intercept?

The graph of a linear function is shown on the coordinate grid. What is the slope?

A bus travels 25 miles in 30 minutes. Which graph has a slope that best represents the number of miles per minute the bus travels?
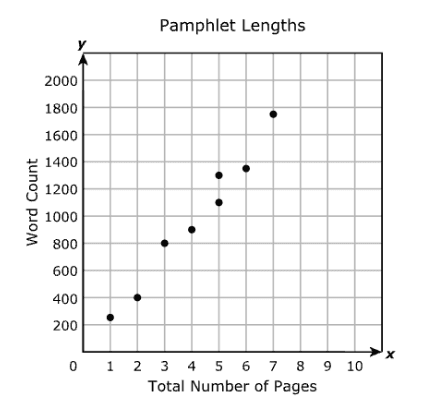
An organization published pamphlets of different lengths. The scatterplot shows the relationship between the number of pages and the word count of each pamphlet. Based on the data, which of these is the best prediction of the word count for a 10-page pamphlet?
The graph of a linear function is shown on the grid. Create an equation that represents the relationship shown on the graph.
y = ____x +_______
Order from least to greatest.
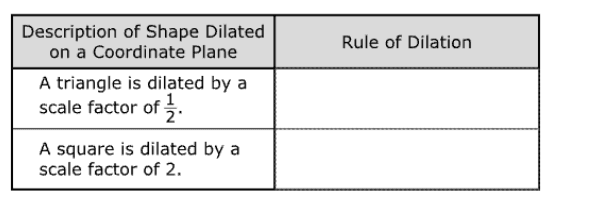
The table describes two dilations with the center of dilation at the origin. Which rule describes each dilation?
Which mapping represents y as a function of x?
Polygon A has an area of 27r square meters. Polygon A is dilated by a scale factor of 3 to create Polygon B? What is the area in square meters of Polygon B?
Jessica baked 72 cookies and sold x cookies. Max baked 36 cookies and sold half as many cookies as Jessica did. How many cookies did Jessica sell if they each had the same number of cookies left over?
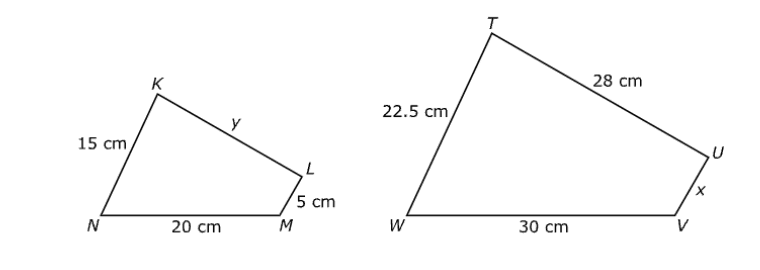
Quadrilateral KLMN is similar to quadrilateral TUVW. Side lengths are given in centimeters. Which proportion must be true?
Jerri paid $2.52 for 6 oranges. Each orange costs the same amount. Which function can be used to find the total cost in dollars, c, for purchasing n oranges?
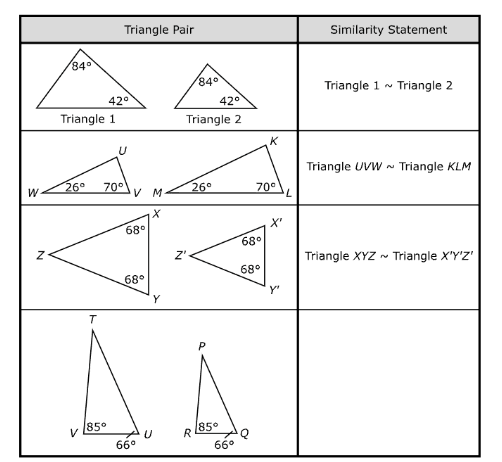
Based on the triangles shown, which similarity statement about the fourth pair of triangles is true and can be sued to complete the table?