represent data on a frequency table, dot plot, or stem-and-leaf plot marked with whole numbers and fractions
Track each student's skills and progress in your Mastery dashboards
Give this quiz to my class
Q 1/5
Score 0
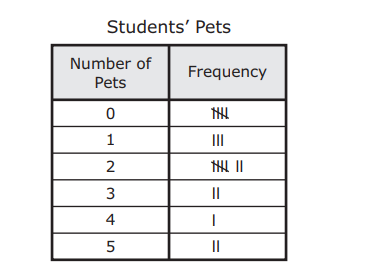
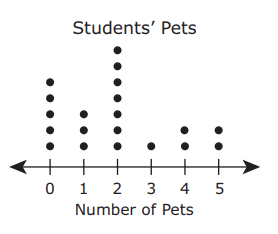
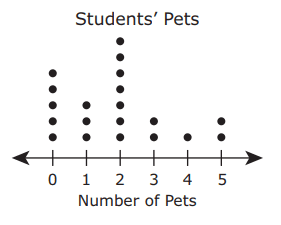
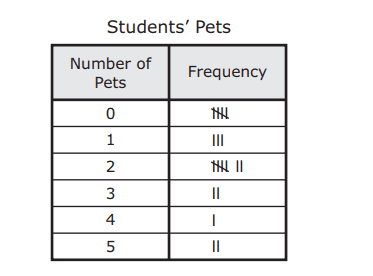
The table shows the number of pets that each student in Mrs. Morris’s class owns. Which dot plot represents the data in the table?
60
Q 2/5
Score 0
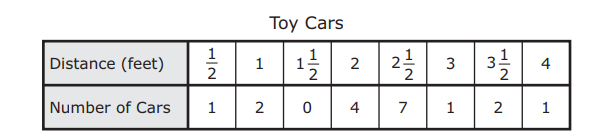
Students pushed toy cars to see how far they would roll. The table shows the number of cars that rolled different distances. Which dot plot represents the data in the table?
60
5 questions
Q.
The table shows the number of pets that each student in Mrs. Morris’s class owns. Which dot plot represents the data in the table?
1
60 sec
4.9.A: Data Analysis
Q.
Students pushed toy cars to see how far they would roll. The table shows the number of cars that rolled different distances. Which dot plot represents the data in the table?
2
60 sec
4.9.A: Data Analysis
Q.
The table shows the total numbers of runs different baseball teams scored in one season. Which stem and leaf plot displays these data?
3
60 sec
4.9.A: Data Analysis
Q.
The list shows the lengths of twelve strings in inches.
26, 30, 19, 21, 24, 26, 18, 31, 27, 21, 17, 29
Which plot represents the data in the list?
4
60 sec
4.9.A: Data Analysis
Q.
A candy store sells fudge by the pound. The dot plot shows the number of customers who bought different numbers of pounds of fudge on Saturday. Which frequency table represents the same data shown on the dot plot?