construct a scatterplot and describe the observed data to address questions of association such as linear, non-linear, and no association between bivariate data
Track each student's skills and progress in your Mastery dashboards
Loading...
Loading...
Loading...
Q 1/2
Score 0
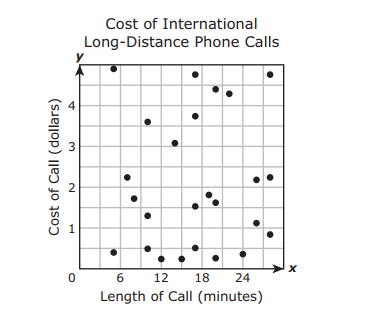
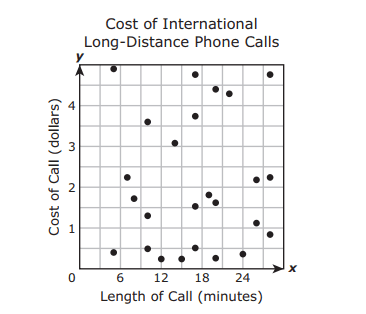
Julie made 25 international long-distance phone calls to London last month. The scatterplot below shows the length and cost of each phone call she made. Which conclusion is best supported by the scatterplot?
60
As the length of a call increases, the cost of the call increases.
As the length of a call increases, the cost of the call remains the same.
As the length of a call increases, the cost of the call decreases.
There is no relationship between the length of a call and the cost of a call.
Q 2/2
Score 0
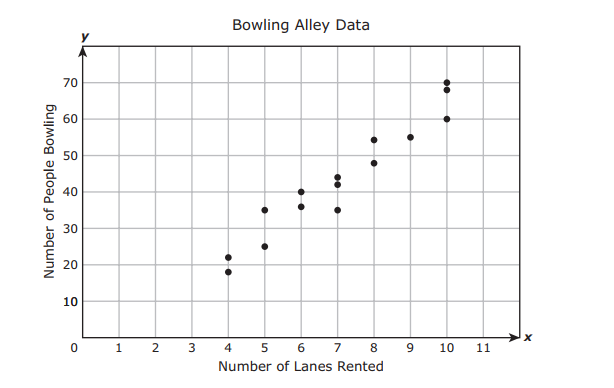
The daily attendance at a bowling alley was recorded for 15 days. The scatterplot shows the number of lanes rented each day and the number of people who bowled that day. Which statement is best supported by the scatterplot?
60
There is no apparent association between the number of lanes rented and the number of people who bowl.
There is a positive linear association between the number of lanes rented and the number of people who bowl.
There is a negative linear association between the number of lanes rented and the number of people who bowl.
There is a non-linear association between the number of lanes rented and the number of people who bowl.
Give this quiz to my class
2 questions
Q.
Julie made 25 international long-distance phone calls to London last month. The scatterplot below shows the length and cost of each phone call she made. Which conclusion is best supported by the scatterplot?
1
60 sec
8.11.A: Measurement and Data
Q.
The daily attendance at a bowling alley was recorded for 15 days. The scatterplot shows the number of lanes rented each day and the number of people who bowled that day. Which statement is best supported by the scatterplot?