use a trend line that approximates the linear relationship between bivariate sets of data to make predictions
Track each student's skills and progress in your Mastery dashboards
Give this quiz to my class
Q 1/6
Score 0
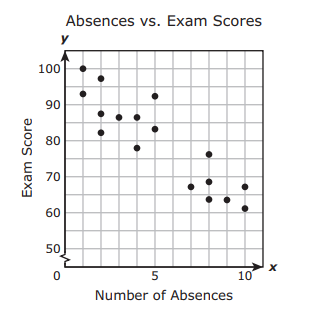
Mrs. Collins made a scatterplot to show the relationship between the number of absences a student in her class has and the student’s final exam score. Based on this scatterplot, approximately what score should a student with 6 absences expect to receive on the final exam?
60
67
92
76
65
Q 2/6
Score 0
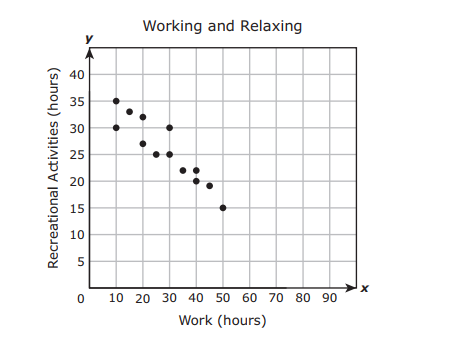
The scatterplot shows the average number of hours each of 13 people spends at work every week and the average number of hours each of them spends on recreational activities every week. Based on the scatterplot, what is the best prediction of the average number of hours a person spends at work every week if that person spends an average of 10 hours on recreational activities every week?
60
50 h
33 h
85 h
65 h
6 questions
Q.
Mrs. Collins made a scatterplot to show the relationship between the number of absences a student in her class has and the student’s final exam score. Based on this scatterplot, approximately what score should a student with 6 absences expect to receive on the final exam?
1
60 sec
8.5.D: Proportionality
Q.
The scatterplot shows the average number of hours each of 13 people spends at work every week and the average number of hours each of them spends on recreational activities every week. Based on the scatterplot, what is the best prediction of the average number of hours a person spends at work every week if that person spends an average of 10 hours on recreational activities every week?
2
60 sec
8.5.D: Proportionality
Q.
The manager of a restaurant recorded how many people were in different groups of customers and how much those groups spent on food and beverages. The scatterplot below shows the data she recorded. Based on this scatterplot, about how much money would a group of 10 people be expected to spend on food and beverages at this restaurant?
3
60 sec
8.5.D: Proportionality
Q.
The scatterplot shows the number of hours that 12 people spent learning to type on a keyboard and each person’s average typing speed.Based on the scatterplot, what is the best prediction of a person’s average typing speed in words per minute (wpm) if the person has spent 70 hours learning to type?
4
60 sec
8.5.D: Proportionality
Q.
The scatterplot shows the number of people in each of 8 different households and the average amount of money each household spent on groceries. Based on the scatterplot, what is the best prediction of the average amount of money spent on groceries for a household that has 7 people?
5
60 sec
8.5.D: Proportionality
Q.
Ben collected data from a group of 12 people. He measured each person’s resting heart rate and recorded the average number of hours each person exercised per week. He created a scatterplot to show the data he collected. Based on the scatterplot, what is the best prediction of the resting heart rate, in beats per minute, of a person who exercises an average of 8 hours each week?