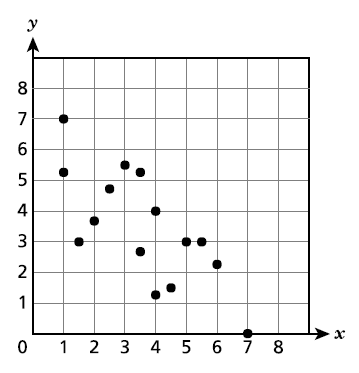
Know that straight lines are widely used to model relationships between two quantitative variables. For scatter plots that suggest a linear association, informally fit a straight line, and informally assess the model fit by judging the closeness of the data points to the line.
Track each student's skills and progress in your Mastery dashboards
Give this quiz to my class
Q 1/4
Score 0
60
Q 2/4
Score 0
60
4 questions
Q.
1
60 sec
8.SP.A.2
Q.
2
60 sec
8.SP.A.2
Q.
The shoe sizes and the heights for 20 classmates were plotted as ordered pairs on a scatter plot. A line of best fit was drawn to model the data. Which scatter plot shows the most accurate line of best fit?