Loading...
April 23 Thursday Night Lights TEKS 4.9A Summarizing Data
Quiz by Dr. Nnenna Wilson, MPH, Ph.D.
Track each student's skills and progress in your Mastery dashboards
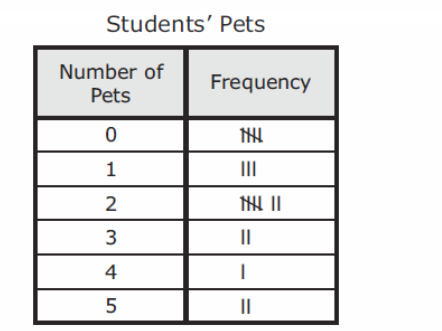
The table shows the number of pets that each student in Mrs. Morri's class owns.
which dot plot represents the data in the table?


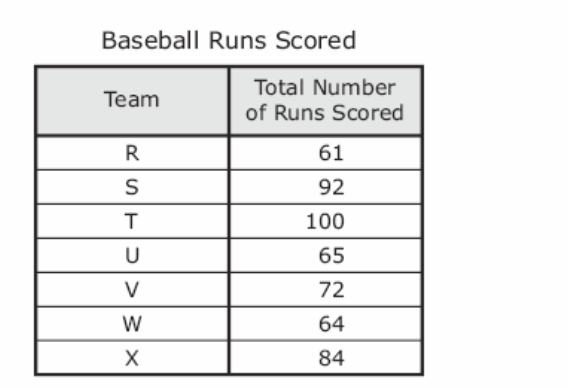
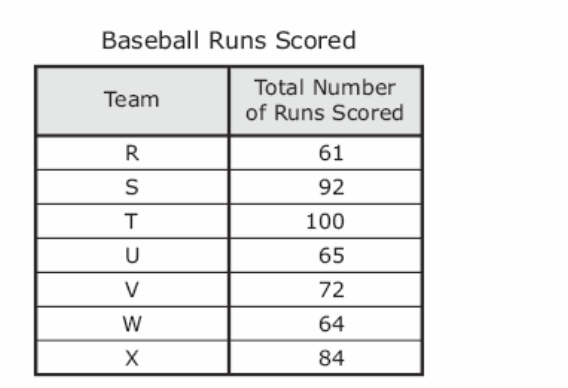
The table shows the total number of runs different baseball teams scored in one season.
Which stem and leaf polt displays these data?


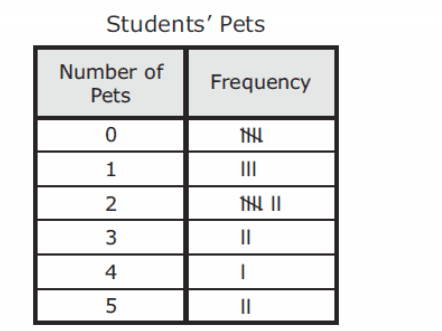
The table shows the number of pets that each student in Mrs. Morri's class owns.
which dot plot represents the data in the table?
The table shows the total number of runs different baseball teams scored in one season.
Which stem and leaf polt displays these data?
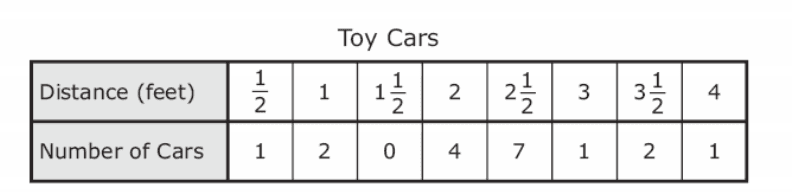
The students pushed toy cars to see how far they would roll. The table shows the number of cars that rolled different distances.
Which dot plot represents the data in the table?
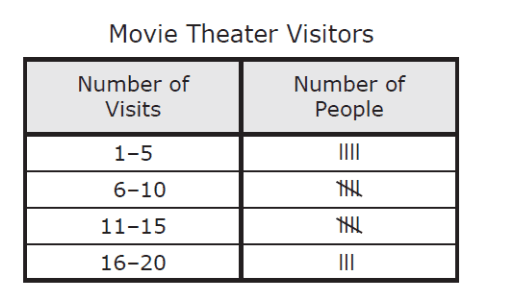
The frequency table shows the number of times some people visited a movie theater last year.
Which set of dat could the frequency table represent?
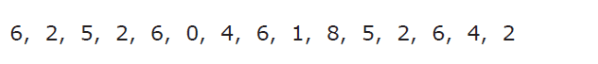
The list shows the number of articles written by different reporters at a newspaper last month.
Which dot plot displays the same data?
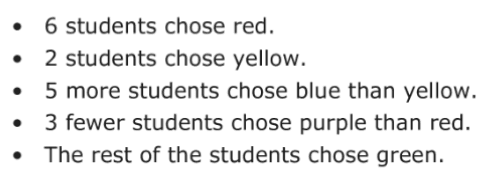
The list gives information about the favorite color of each of 22 students.
Which frequency table represents the number of students who chose each color?