Tag the questions with any skills you have. Your dashboard will track each student's mastery of each skill.
Give this quiz to my class
Q 1/5
Score 0
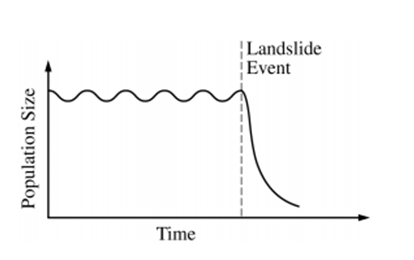
Undersea landslides can disrupt marine habitats by burying organisms that live on the ocean floor. The graph shows the size of a population of a certain organism that lives on the ocean floor. The population was affected by a recent landslide at the time indicated on the graph. Which of the following BEST predicts how the population will be affected by the landslide?
60
The surviving organisms will evolve into a new species
The population will adapt to deeper waters to avoid future landslides
The reduced population will have a greater number of different genes than the initial population
The reduced population will likely have allelic frequencies that are different from the initial population
Q 2/5
Score 0
Beaked whales feed at various depths, but they defecate at the ocean's surface. Nitrogen-rich whale feces deposited in surface waters supply nutrients for algae that are eaten by surface dwelling fish. Which of the following best predicts what would happen if the whale population decreased?
30
The remaining whales would be forced to forage in the deepest parts of the ocean.
There would be a reduction in surface nitrogen concentration, which would cause algal bloom.
The remaining whales would accumulate mutations at a faster rate.
The surface fish populations would decline due to reduced algae population.
5 questions
Q.
Undersea landslides can disrupt marine habitats by burying organisms that live on the ocean floor. The graph shows the size of a population of a certain organism that lives on the ocean floor. The population was affected by a recent landslide at the time indicated on the graph. Which of the following BEST predicts how the population will be affected by the landslide?
1
60 sec
Q.
Beaked whales feed at various depths, but they defecate at the ocean's surface. Nitrogen-rich whale feces deposited in surface waters supply nutrients for algae that are eaten by surface dwelling fish. Which of the following best predicts what would happen if the whale population decreased?
2
30 sec
Q.
The process illustrated in the models depicted all result in which of the following?
3
30 sec
Q.
The figures show changes in populations of two species of flour beetles in cultures with and without parasites. Each data point represents the mean population size from ten culture dishes of equal size and food content. The data over the duration of the experiment provide the strongest support for which of the following conclusions regarding the effect of the parasite on Tribolium populations?
4
30 sec
Q.
In figure 1 the difference between the two curves can best be attributed to which of the following?