Tag the questions with any skills you have. Your dashboard will track each student's mastery of each skill.
Give this quiz to my class
Q 1/4
Score 0
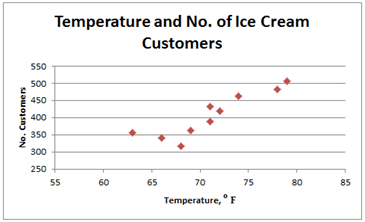
The scatterplot below shows the relationship between the outside temperature at noon and the total number of customers at an ice cream shop for that particular day. The data were collected for 10 randomly-selected days during the year. Based on the scatterplot, about how many customers would be expected if the temperature were 75 degrees?
120
300
525
475
375
Q 2/4
Score 0
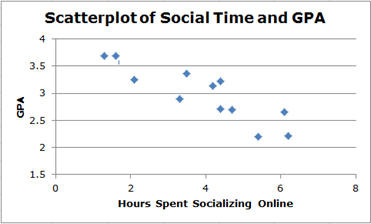
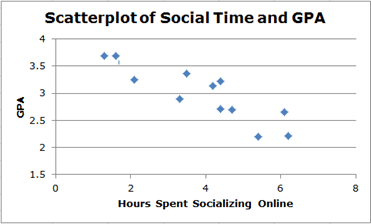
The scatterplot below depicts the relationship between teenage girls' time spent socializing each day on social networking sites and their high school GPAs. The relationship between hours spent socializing online and GPA can be best described as
120
strong and positive
Strong and negative
weak and positive
weak and negative
4 questions
Q.
The scatterplot below shows the relationship between the outside temperature at noon and the total number of customers at an ice cream shop for that particular day. The data were collected for 10 randomly-selected days during the year. Based on the scatterplot, about how many customers would be expected if the temperature were 75 degrees?
1
120 sec
Q.
The scatterplot below depicts the relationship between teenage girls' time spent socializing each day on social networking sites and their high school GPAs. The relationship between hours spent socializing online and GPA can be best described as