Loading...
Track each student's skills and progress in your Mastery dashboards
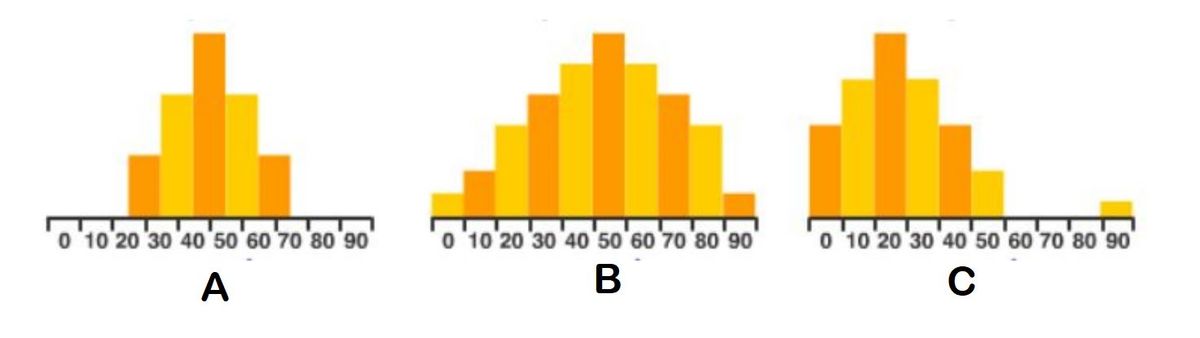
Which image shows data with an outlier, A B or C?
C
B
A
What measure of center are you finding when you add up all the data points and divide that sum by the number of data points in the set?
Which image shows data with an outlier, A B or C?

This data set has an outlier? { 8, 9, 10, 7, 5, 6, 5, 3}
What measure of center are you finding when you identify the data point that is represented in the set most often?
Which image shows data skewed left?
What measure of center are you finding when you put the data points in numerical order from least to greatest and find the middle of the set?
Which image shows data skewed right?
This is a statistical question. "How many pets does a typical family own?"
What is the Mode of this data set? { 3, 7, 5, 9, 3, 5, 3, 7, 2, 4, 2 }
Which of these displays is a Box and Whisker chart?
This is a statistical question. "What is your best friend's favorite color?"
What is the Range of this data set? { 3, 7, 5, 9, 3, 5, 3, 7, 2, 4, 2 }
What is the Median of this data set? { 2, 2, 2, 3, 3, 3, 5, 7, 7, 9 }
What number is missing from the set? { 4, 6, ? } Mean = 6
This data set has an outlier? { 12, 19, 14, 42, 12, 11, 20, 19}
Which one of these is a measure of variation and not a measure of center?
The Median would change if we take a value out of the data set? { 22, 23, 24, 25, 26, 27, 28 }
What measures would change if we added 21 to the data set? { 22, 23, 24, 25, 26, 27, 28 }
Which of these displays is a Histogram?
Which of these displays is a Stem and Leaf plot?
This is a statistical question. "How many days are there in April?"
Which of these displays is a Dot Plot?
Which image shows data with normal/symmetrical distribution?
The Mode would change if we take a value out of the data set? { 22, 23, 24, 25, 26, 27, 28 }
This is a statistical question. "What was your grade on the math test?"