write an equation in the form y = mx + b to model a linear relationship between two quantities using verbal, numerical, tabular, and graphical representations
represent linear proportional situations with tables, graphs, and equations in the form of y = kx
Track each student's skills and progress in your Mastery dashboards
Give this quiz to my class
Q 1/10
Score 0
Robert works at an auto-parts store. He is paid $538
salary per week. He also receives $9 for each item he
sells. Which equation best represents the given situation?
300
y = 538x + 9
y = 9x + 538x
y = 538x + 9
y = 9x + 538
Q 2/10
Score 0
300
10 questions
Q.
Robert works at an auto-parts store. He is paid $538
salary per week. He also receives $9 for each item he
sells. Which equation best represents the given situation?
1
300 sec
8.5.I: Proportionality
Q.
2
300 sec
8.5.I: Proportionality
Q.
3
300 sec
8.5.F: Proportionality
Q.
Which of the following situations can be represented by
a proportional relationship?
4
300 sec
8.5.H: Proportionality
Q.
5
300 sec
8.4.C: Proportionality
Q.
Kevin is renting a mechanical bull. The cost of renting
the bull is $120 plus $15 per hour. Which graph
represents his total cost, c, for renting the mechanical bull
time, t? (HINT: 15x+120)
6
300 sec
8.5.B: Proportionality
Q.
Mike is paying his friend $10 an hour plus $150 for building materials for a tree house. Which table best represents the equation? (HINT 10x+150)
7
300 sec
8.5.B: Proportionality
Q.
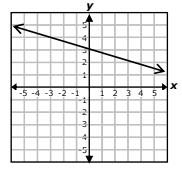
What is the y-intercept of the graph?
8
300 sec
8.4.C: Proportionality
Q.
True or False? If a graph is proportional, it will cross through the origin.