Describing the nature of the attribute under investigation, including how it was measured and its units of measurement.
Track each student's skills and progress in your Mastery dashboards
Q 1/1
Score 0
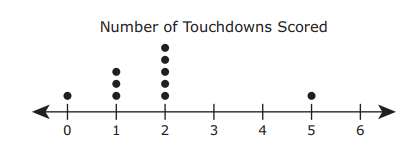
The dot plot shows the number of touchdowns a football team scored in 10 games last season. Which statement best describes the data shown in the dot plot?
60
The peak of the data is at 5.
The data are clustered from 0 to 2.
The data distribution has no gaps.
The data distribution is symmetrical.
Loading...
Loading...
1 question
Q.
The dot plot shows the number of touchdowns a football team scored in 10 games last season. Which statement best describes the data shown in the dot plot?