Tag the questions with any skills you have. Your dashboard will track each student's mastery of each skill.
Give this quiz to my class
Q 1/11
Score 0
Relationship between or among variables.
30
Association
Q 2/11
Score 0
A cause and effect relationship in which one variable controls the changes in another variable.
30
Causation
11 questions
Q.
Relationship between or among variables.
1
30 sec
Q.
A cause and effect relationship in which one variable controls the changes in another variable.
2
30 sec
Q.
a statistical index of the relationship between two things (from -1 to +1)
3
30 sec
Q.
extend; predict on the basis of known data
4
30 sec
Q.
(v.) to insert between other parts or things; to present as an addition or correction
5
30 sec
Q.
a line drawn in a scatter plot to fit most of the dots and shows the relationship between the two sets of data
6
30 sec
Q.
A representation of a situation, function or relationship.
7
30 sec
Q.
summarizes the points of a scatterplot and provides the means for making predictions
8
30 sec
Q.
graph that shows the residuals on the vertical axis and the independent variable on the horizontal axis
9
30 sec
Q.
the difference between an observed value of the response variable and the value predicted by the regression line
10
30 sec
Q.
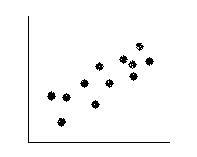
a graphed cluster of dots, each of which represents the values of two variables. The slope of the point suggests the directions of the relationship between the two variables The amount of scatter suggests the strength of the correlation.