Loading...
Monday Dot plots/ Frequency tables
Quiz by Karina Garcia
Track each student's skills and progress in your Mastery dashboards
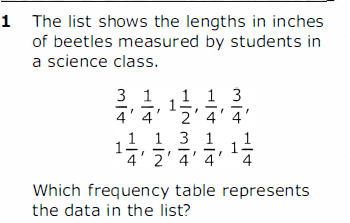
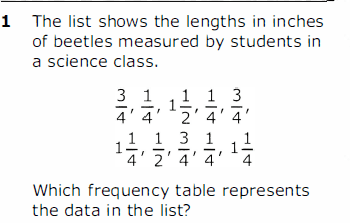
Which frequency table represents the data in the list


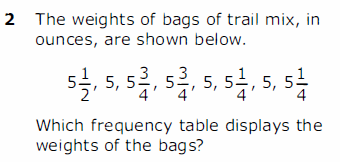
Which frequency table displays the weights of the bags


Which frequency table represents the data in the list
Which frequency table displays the weights of the bags

Which dot plot displays the same data

Which dot plot displays the same data?

Which dot plot displays the same data?

Which dot plot displays these data?

What age in years is missing a data point on the dot plot?

What distance in miles is missing a data point on the dot plot?

Which frequency table represents the same data shown in the dot plot?

Which frequency table displays the same data

Which dot plot displays these data

Which dot plot represents the data in the table?

Which frequency table represents the number of students who chose each pet?

Which frequency table represents the number of students who chose each fruit?
