Describe any overall pattern and any deviations from the overall pattern with reference to the context in which the data were gathered.
Track each student's skills and progress in your Mastery dashboards
Give this quiz to my class
Q 1/3
Score 0
60
Q 2/3
Score 0
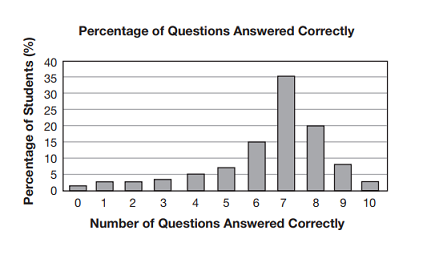
The bar graph below shows how many questions various percentages of students in a class answered correctly on a recent 10-question quiz.
Which statement BEST describes the data displayed in the bar graph?
60
The number of quiz questions answered correctly is clustered around 7 out of 10.
Most of the students answered approximately 35% of the quiz questions correctly.
Half the class answered from 0 to 5 of the 10 questions correctly.
The percentage of students increases as the number of questions answered correctly
increases.
3 questions
Q.
1
60 sec
M06.D-S.1.1.3
Q.
The bar graph below shows how many questions various percentages of students in a class answered correctly on a recent 10-question quiz.
Which statement BEST describes the data displayed in the bar graph?
2
60 sec
M06.D-S.1.1.3
Q.
The histogram below represents the weights, rounded to the nearest pound, of several orders of dog food.
Which statement BEST describes the weights of the orders represented in the histogram?