Estimate the value of irrational numbers without a calculator (limit whole number radicand to less than 144). Example: √5 is between 2 and 3 but closer to 2.
Apply one or more properties of integer exponents to generate equivalent numerical expressions without a calculator (with final answers expressed in exponential form with positive exponents). Properties will be provided. Example: 3^12 × 3^⎯15 = 3^⎯3 = 1/(3^3 )
Use square root and cube root symbols to represent solutions to equations of the form x^2 = p and x^3 = p, where p is a positive rational number. Evaluate square roots of perfect squares (up to and including 12^2 ) and cube roots of perfect cubes (up to and including 5^3 ) without a calculator. Example: If x^2 = 25 then x = ±√25.
Estimate very large or very small quantities by using numbers expressed in the form of a single digit times an integer power of 10 and express how many times larger or smaller one number is than another. Example: Estimate the population of the United States as 3 × 10^8 and the population of the world as 7 × 10^9 and determine that the world population is more than 20 times larger than the United States’ population.
Apply concepts of rational and irrational numbers.
Determine whether a number is rational or irrational. For rational numbers, show that the decimal expansion terminates or repeats (limit repeating decimals to thousandths).
Convert a terminating or repeating decimal to a rational number (limit repeating decimals to thousandths).
Locate/identify rational and irrational numbers at their approximate locations on a number line.
Apply the Pythagorean theorem to determine unknown side lengths in right triangles in real-world and mathematical problems in two and three dimensions. (Figures provided for problems in three dimensions will be consistent with Eligible Content in grade 8 and below.)
Represent and use expressions and equations to solve problems involving radicals and integer exponents.
Analyze and describe linear relationships between two variables, using slope.
Graph proportional relationships, interpreting the unit rate as the slope of the graph. Compare two different proportional relationships represented in different ways. Example: Compare a distance-time graph to a distance-time equation to determine which of two moving objects has greater speed.
Use similar right triangles to show and explain why the slope m is the same between any two distinct points on a non-vertical line in the coordinate plane.
Derive the equation y = mx for a line through the origin and the equation y = mx + b for a line intercepting the vertical axis at b.
Write, solve, graph, and interpret linear equations in one or two variables, using various methods.
Solve linear equations that have rational number coefficients, including equations whose solutions require expanding expressions using the distributive property and collecting like terms.
Interpret solutions to a system of two linear equations in two variables as points of intersection of their graphs because points of intersection satisfy both equations simultaneously.
Solve real-world and mathematical problems leading to two linear equations in two variables. Example: Given coordinates for two pairs of points, determine whether the line through the first pair of points intersects the line through the second pair.
Define, evaluate, and compare functions displayed algebraically, graphically, or numerically in tables or by verbal descriptions.
Determine whether a relation is a function.
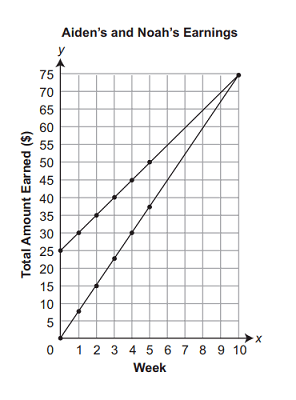
Compare properties of two functions, each represented in a different way (i.e., algebraically, graphically, numerically in tables, or by verbal descriptions). Example: Given a linear function represented by a table of values and a linear function represented by an algebraic expression, determine which function has the greater rate of change.
Interpret the equation y = mx + b as defining a linear function whose graph is a straight line; give examples of functions that are not linear.
Construct a function to model a linear relationship between two quantities. Determine the rate of change and initial value of the function from a description of a relationship or from two (x, y) values, including reading these from a table or from a graph. Interpret the rate of change and initial value of a linear function in terms of the situation it models and in terms of its graph or a table of values.
Describe qualitatively the functional relationship between two quantities by analyzing a graph (e.g., where the function is increasing or decreasing, linear or nonlinear). Sketch or determine a graph that exhibits the qualitative features of a function that has been described verbally.
Apply properties of geometric transformations to verify congruence or similarity.
Identify and apply properties of rotations, reflections, and translations. Example: Angle measures are preserved in rotations, reflections, and translations.
Apply the Pythagorean theorem to find the distance between two points in a coordinate system.
Solve problems involving right triangles by applying the Pythagorean theorem.
Apply the converse of the Pythagorean theorem to show a triangle is a right triangle.
Apply formulas for the volumes of cones, cylinders, and spheres to solve real-world and mathematical problems. Formulas will be provided.
Analyze and interpret bivariate data displayed in multiple representations.
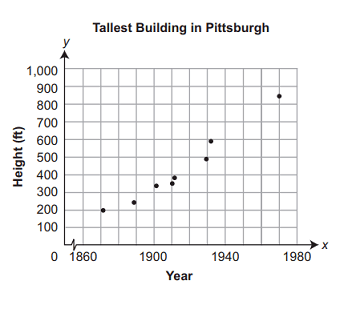
Construct and interpret scatter plots for bivariate measurement data to investigate patterns of association between two quantities. Describe patterns such as clustering, outliers, positive or negative correlation, linear association, and nonlinear association.
Use the equation of a linear model to solve problems in the context of bivariate measurement data, interpreting the slope and intercept. Example: In a linear model for a biology experiment, interpret a slope of 1.5 cm/hr as meaning that an additional hour of sunlight each day is associated with an additional 1.5 cm in mature plant height.
Construct and interpret a two-way table summarizing data on two categorical variables collected from the same subjects. Use relative frequencies calculated for rows or columns to describe possible associations between the two variables. Example: Given data on whether students have a curfew on school nights and whether they have assigned chores at home, is there evidence that those who have a curfew also tend to have chores?
Track each student's skills and progress in your Mastery dashboards