Construct and interpret scatter plots for bivariate measurement data to investigate patterns of association between two quantities. Describe patterns such as clustering, outliers, positive or negative correlation, linear association, and nonlinear association.
Use the equation of a linear model to solve problems in the context of bivariate measurement data, interpreting the slope and intercept. Example: In a linear model for a biology experiment, interpret a slope of 1.5 cm/hr as meaning that an additional hour of sunlight each day is associated with an additional 1.5 cm in mature plant height.
Construct and interpret a two-way table summarizing data on two categorical variables collected from the same subjects. Use relative frequencies calculated for rows or columns to describe possible associations between the two variables. Example: Given data on whether students have a curfew on school nights and whether they have assigned chores at home, is there evidence that those who have a curfew also tend to have chores?
Understand that patterns of association can be seen in bivariate categorical data by displaying frequencies and relative frequencies in a two-way table.
Track each student's skills and progress in your Mastery dashboards
Give this quiz to my class
Q 1/12
Score 0
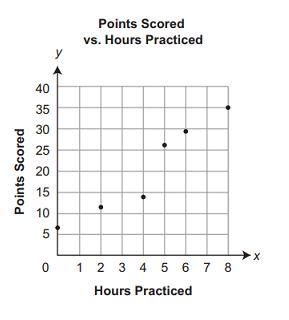
The scatter plot below shows how many points Denise scored in a game based on the number of hours she practiced.
Using a line of best fit, how many points should Denise expect to score after she practices for 3 hours?
60
12
10
16
7
Q 2/12
Score 0
60
12 questions
Q.
The scatter plot below shows how many points Denise scored in a game based on the number of hours she practiced.
Using a line of best fit, how many points should Denise expect to score after she practices for 3 hours?
1
60 sec
M08.D-S.1.1
Q.
2
60 sec
M08.D-S.1.1
Q.
3
60 sec
M08.D-S.1.1.1
Q.
4
60 sec
M08.D-S.1.1.1
Q.
5
60 sec
M08.D-S.1.1.3
Q.
6
60 sec
M08.D-S.1.2.1
Q.
7
30 sec
M08.D-S.1.1.1
Q.
8
30 sec
M08.D-S.1.1.2
Q.
Blake interviewed 24 students to see whether they collected sports cards and whether they participated in sports. The table below shows his data.How many of the students Blake interviewed participate in sports?