identify functions using sets of ordered pairs, tables, mappings, and graphs
Track each student's skills and progress in your Mastery dashboards
Give this quiz to my class
Q 1/13
Score 0
Judy can decorate 3 cakes in 5 hours. Which graph has a slope that best represents the number of cakes per hour Judy can decorate?
60
#texas/daa3a702-3383-41b4-ae88-d585c8b2bd21/D.png
#texas/daa3a702-3383-41b4-ae88-d585c8b2bd21/B.png
#texas/daa3a702-3383-41b4-ae88-d585c8b2bd21/C.png
#texas/daa3a702-3383-41b4-ae88-d585c8b2bd21/A.png
Q 2/13
Score 0
Which graph shows a proportional relationship between x and y?
30
#texas/4876ccaa-c493-486a-ad31-ede91c8ef9b3/A.png
#texas/4876ccaa-c493-486a-ad31-ede91c8ef9b3/D.png
#texas/4876ccaa-c493-486a-ad31-ede91c8ef9b3/C.png
#texas/4876ccaa-c493-486a-ad31-ede91c8ef9b3/B.png
13 questions
Q.
Judy can decorate 3 cakes in 5 hours. Which graph has a slope that best represents the number of cakes per hour Judy can decorate?
1
60 sec
8.4.B: Proportionality
Q.
Which graph shows a proportional relationship between x and y?
2
30 sec
8.5.F: Proportionality
Q.
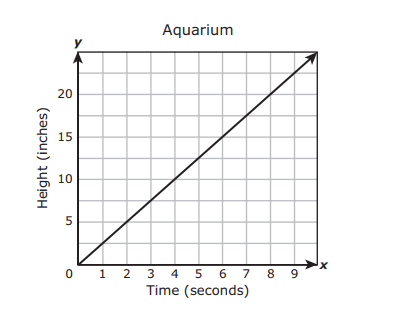
An aquarium is being filled with water. The graph shows the height of the water over time as the aquarium is being filled. Which statement best describes the rate of change for this situation?
3
30 sec
8.4.B: Proportionality
Q.
The value of y varies directly with x. When y= 75, x =$\frac{1}{2}$. What is the value of y when x is $2\tfrac{1}{4}$ ?
4
30 sec
8.5.E: Proportionality
Q.
A tree in Dante’s neighborhood grew 18 inches in the first 2 years after it was planted. If the tree continues to grow at this same rate, which graph best represents the growth rate of the tree in inches per year?
5
30 sec
8.4.B: Proportionality
Q.
On a field trip, there are 3 adults for every 45 students. Which graph models a relationship with the same unit rate?
6
30 sec
8.4.B: Proportionality
Q.
Which graph shows a non-proportional linear relationship between x and y?
7
30 sec
8.5.F: Proportionality
Q.
A water hose discharges water at a rate of 45 gallons per minute. Which graph has a slope that best represents this rate?
8
30 sec
8.4.B: Proportionality
Q.
The approximate volume in milliliters, m, for a volume of f fluid ounces is equal to 29.57 times the value of f. Which table represents this relationship?
9
30 sec
8.5.A: Proportionality
Q.
Which graph does NOT represent y as a function of x?
10
30 sec
8.5.G: Proportionality
Q.
Which set of ordered pairs represents y as a function of x?
11
30 sec
8.5.G: Proportionality
Q.
Leanor pays a total of $16.50 for every 6 shirts she has dry-cleaned. Which graph models a relationship with the same unit rate?
12
30 sec
8.4.B: Proportionality
Q.
The number of gift baskets Nikki can make varies directly with the amount of time she spends making the baskets. She can make 4 baskets in 1/2 hour. How many baskets can Nikki make in 5 hours? Be sure to use the correct place value.