Use the mean and standard deviation of a data set to fit it to a normal distribution and to estimate population percentages. Recognize that there are data sets for which such a procedure is not appropriate. Use calculators, spreadsheets, and tables to estimate areas under the normal curve.
Fit a function to the data; use functions fitted to data to solve problems in the context of the data. Use given functions or choose a function suggested by the context. Emphasize linear, quadratic, and exponential models.
Track each student's skills and progress in your Mastery dashboards
Give this quiz to my class
Q 1/5
Score 0
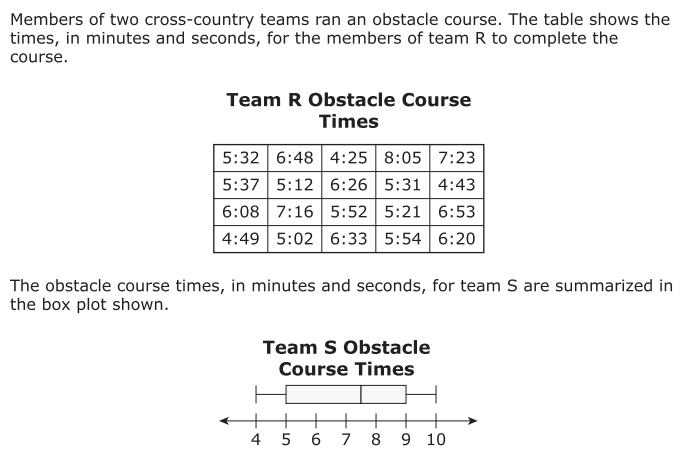
Which histogram represents the times from Team R on the obstacle course?
60
Q 2/5
Score 0
60
5 questions
Q.
Which histogram represents the times from Team R on the obstacle course?
1
60 sec
HSS.ID.A.1
Q.
2
60 sec
HSS.ID.A.4
Q.
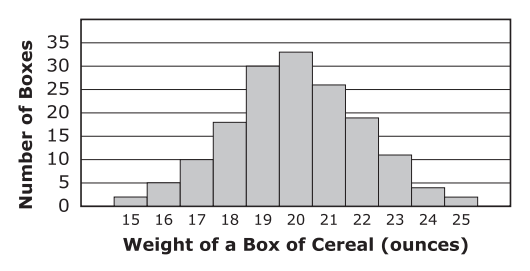
The distribution of weights (rounded to the nearest whole number) of all boxes of a certain cereal is approximately normal with mean 20 ounces and standard deviation 2 ounces.
A sample of the cereal boxes was selected, and the weights of the selected boxesare summarized in the histogram shown.
Which of these values is the 'best' estimate of the number of boxes in the sample with weights that are more than 1.5 standard deviations above the mean?
3
60 sec
HSS.ID.A.4
Q.
4
60 sec
HSS.ID.B.6.A
Q.
To investigate housing needs in the future, a town planning committee created a model to help predict the growth of the population of the town. The committee created a model based on data about the population of the town for five years. The data are shown in the table.
Consider the value predicted by the model for the year 2010. Which statement is true?