Use variables to represent two quantities in a real-world problem that change in relationship to one another; write an equation to express one quantity, thought of as the dependent variable, in terms of the other quantity, thought of as the independent variable. Analyze the relationship between the dependent and independent variables using graphs and tables, and relate these to the equation.
Track each student's skills and progress in your Mastery dashboards
Q 1/1
Score 0
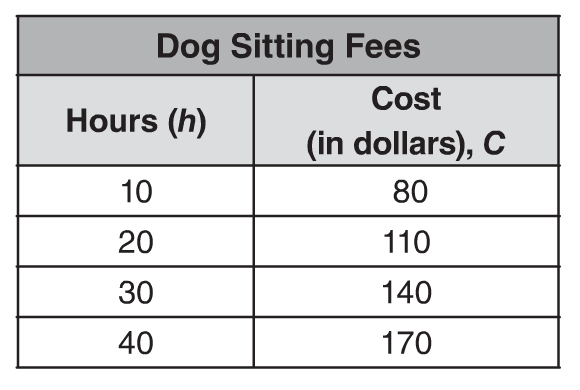
The table shows the relationship between hours spent dog sitting and the cost of the services. Which equation represents the situation?
120
C=3h-20
C=2h+30
C=2h+50
C=3h+50
Loading...
Loading...
1 question
Q.
The table shows the relationship between hours spent dog sitting and the cost of the services. Which equation represents the situation?