Loading...
Linear and Nonlinear Texts
Quiz by Kesil Arollado
Track each student's skills and progress in your Mastery dashboards
What type of nonlinear text is shown above?

Pictograph
Line Graph
Bar Graph
Which month has the highest number of active cases?
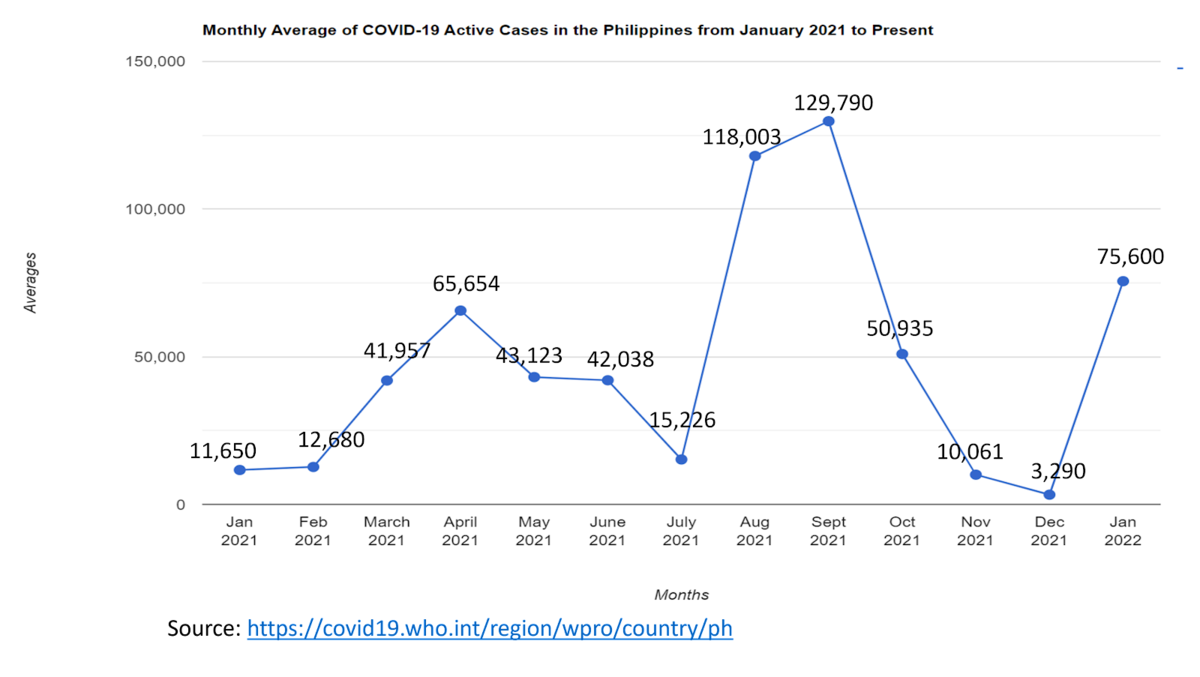
September 2021
October 2021
April 2021
August 2021
What type of nonlinear text is shown above?

Which month has the highest number of active cases?
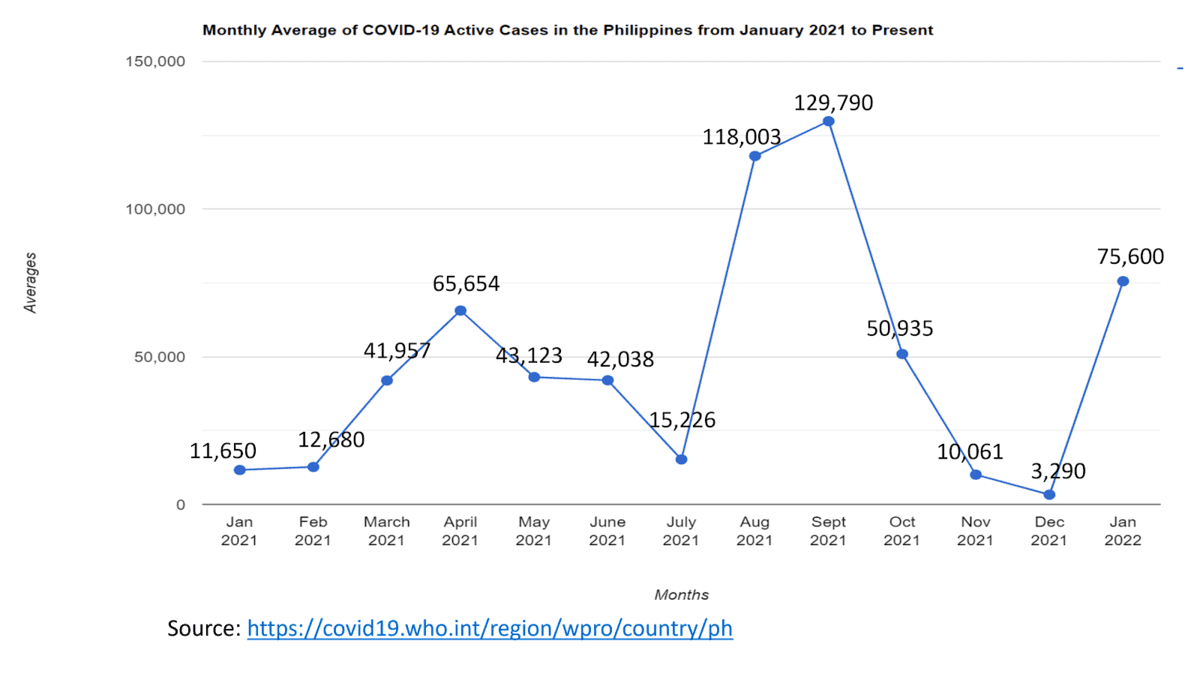
How about the month with the lowest number of active cases?
What is the difference in a number of COVID-19 active cases between August and September?
What is the trend shown in the graph?
As of January 2022, the number of cases increases so what would you suggest to protect your family and yourself against COVID-19?
It is a type of graph that has categories on the x-axis and numbers on the y-axis (but these are interchangeable). This means that you can compare numbers between different categories. The categories need to be independent, that is changes in one of them do not affect the others.
This is another type of graph that is used to show how numbers have changed over time. It is used when you have data that are connected, and to show trends.
It refers to a means of displaying data or information in rows and columns.
It is a type of diagram that represents a workflow or process. This can also be defined as a diagrammatic representation of an algorithm, a step-by-step approach to solving a task.