Loading...
Q4 PRE-TEST
Quiz by Jennylyn Dulay
Tag the questions with any skills you have. Your dashboard will track each student's mastery of each skill.
The ages of the people attended a virtual meeting are 22,18, 24,32,26,25 and 19. What is the mean age of the people attended the meeting?
The ages of the people attended a virtual meeting are 22,18, 24,32,26,25 and 19. What age represents the third Quartile?
The ages of the people attended a virtual meeting are 22,18, 24,32,26,25 and 19. Which age corresponds to the 5th decile of the data?
Given set of scores of 11 students in Math Test: 12, 7, 8, 15, 9, 6, 10, 14, 11, 6, 13. What measures of position divides the distribution into 10 equal parts?
Given set of scores of 11 students in Math Test: 12, 7, 8, 15, 9, 6, 10, 14, 11, 6, 13. Which score stands for the lower quartile of the data?
Given set of scores of 11 students in Math Test: 12, 7, 8, 15, 9, 6, 10, 14, 11, 6, 13. The 7th decile of the data is ____
Given set of scores of 11 students in Math Test: 12, 7, 8, 15, 9, 6, 10, 14, 11, 6, 13. What is the percentile rank of 12 in the given data?
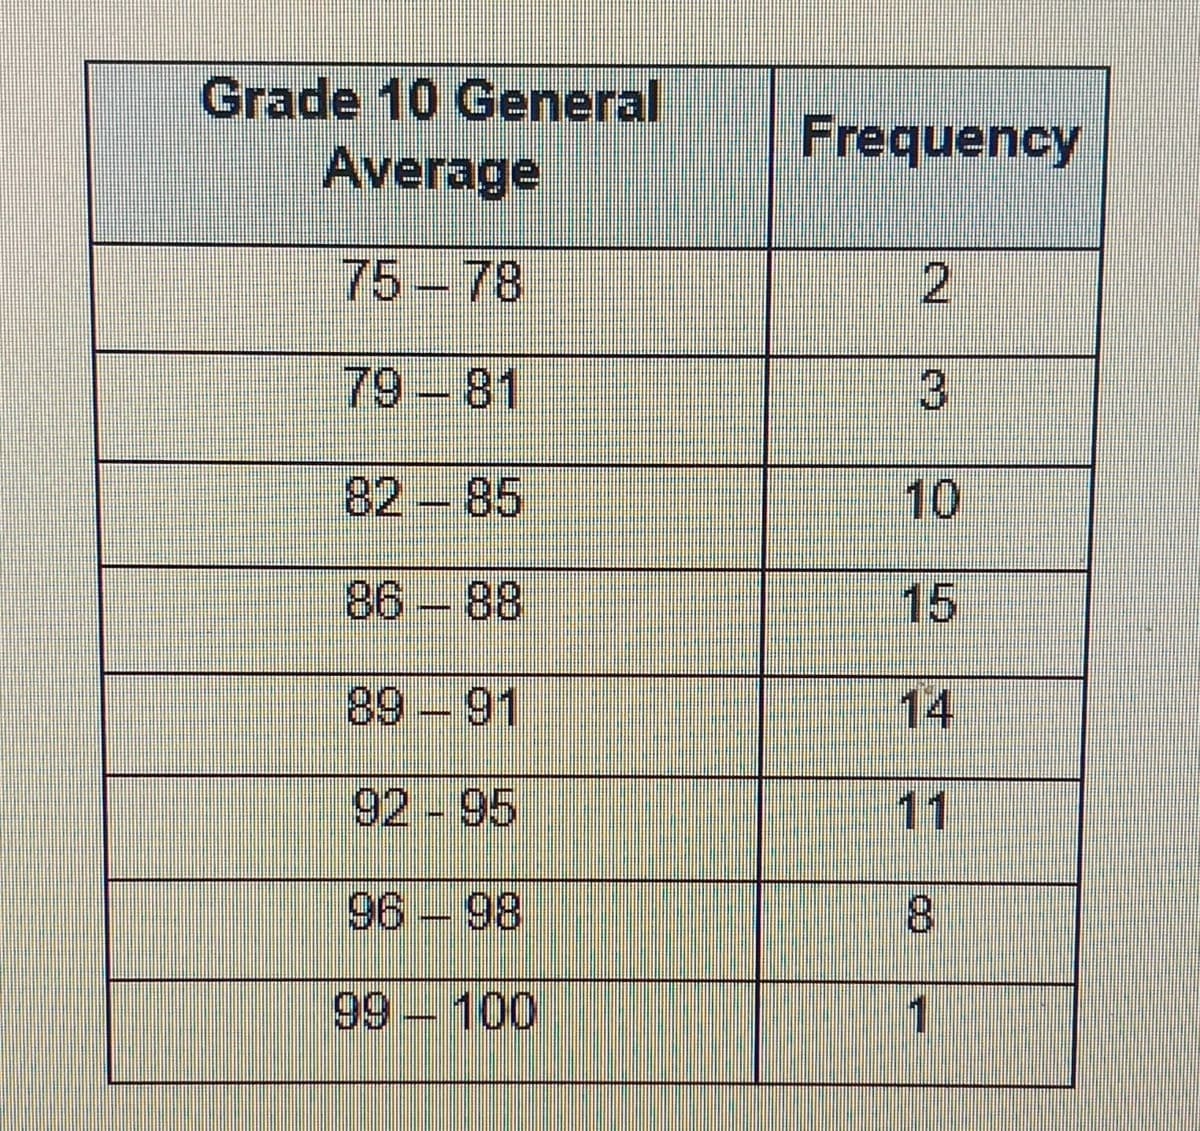
In solving for Q1,the lower boundary to be used is ______

The 5th decile is __________

What is the percentile rank of student who got 36 in the test?

What is the percentile rank of student who got 36 in the test?

How many percent corresponds to quartile 1 if you will interpret it?
What is the 8th decile of the given data?

Compute for P50 of the data.

Compute for the percentile rank of 32.
In a 70-item test, Jerry got a score of 50 which is the third quartile. This means that:
Cathy’s score in Mathematics for the Fourth Quarter is 20 which falls at D8. What does it mean?
Amie ranks 10th in a class of 40. Her percentile rank is ____.
Nory scored at the 99thpercentile on a test. How should we interpret this information?
In a certain score data, if Q3 = 26.5, this means:
A researcher is curious to find out the IQ of students at a certain school. The entire group of students is an example of a_____
Are searcher conducted a study with the total number of 2000 respondents and with a 95% level of confidence. Find the sample size needed using Slovin’s Formula.
Hint: ( slovin’s formula: n/(1 + Ne^2) )
. A researcher wants to conduct a survey if the parents in Marikina City will support the face-to-face classes for their learners with 95% confidence level, equivalent to 1.96 Z-score. He used 0.05margin of error and the probability of success is 0.40. Estimate the number of samples for his survey using Cochran’s formula.
(Hint: Cochran’s formula: no = z^2pq/e^2)
A group of researchers divided the subjects into four groups according to year level and then selected members from each group from the sample. What sampling method was used?
What sampling technique must be used so that every member of the population has an equal chance to be selected as sample?
Which of the following illustrates purposive sampling?
Which of these statements must be included in your survey questionnaire thru google forms?
Which of the following exam grades has a better relative position?
i. A grade of 43 on a Math test with 𝑥̅=40 and s = 3
ii. A grade of 75 on an English test with 𝑥̅=72 and s = 5
Which of the following score has a better relative position?
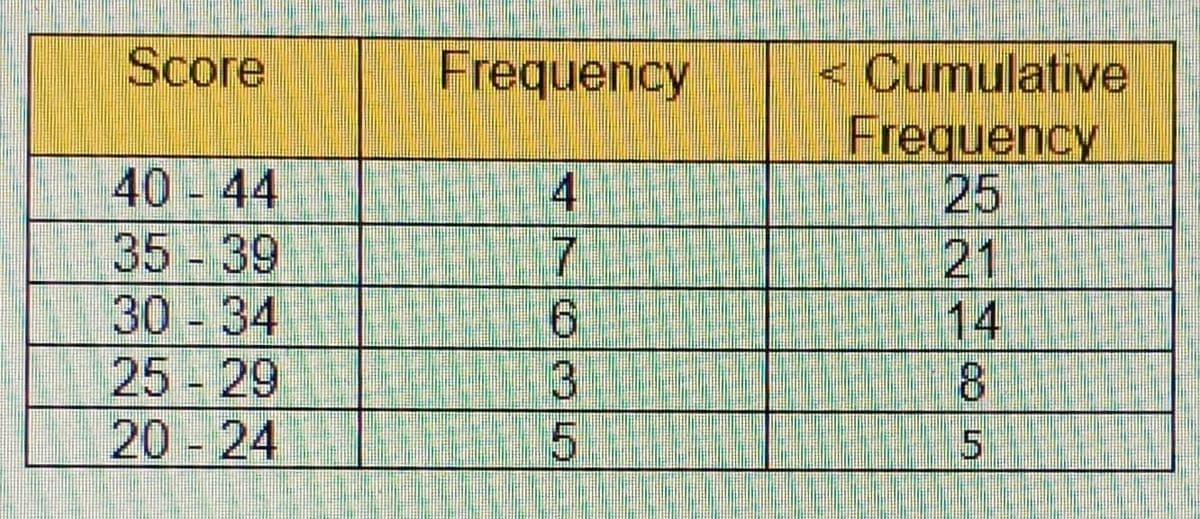
A researcher conducted a survey and visualized the data gathered using the table below. Which part of the research the student should include the table?