Loading...
R1Q4 Module 8 Pre-test
Quiz by Apolonia Solon
Tag the questions with any skills you have. Your dashboard will track each student's mastery of each skill.
It is a type of data which is placed into some kind of order by their position on a non-numeric scale. Which is it?
Ben measured the height of his six snake plants and listed them as follows:
Snake Plant Heights: 60 cm 90 cm 70 cm
80 cm 50 cm 70 cm
What is the mean value for the data set above?
This type of quantitative data can take only certain values. The data variables of this type cannot be divided into smaller parts. Which type of data is decribed in the previous sentences?
The ___________________ is also known as the average value.
Which of the following is a mismatch?
Leslie weighted her eight sugar packs and listed their masses as follows:
Sugar Pack Masses: 120 g 140 g 100 g
95 g 85 g 125 g
115 g
What is the median value for the data set above?
Which of the following statements is INCORRECT?
___________________ simply tells us how often something happened.
Which of the following is an example of NOMINAL DATA?
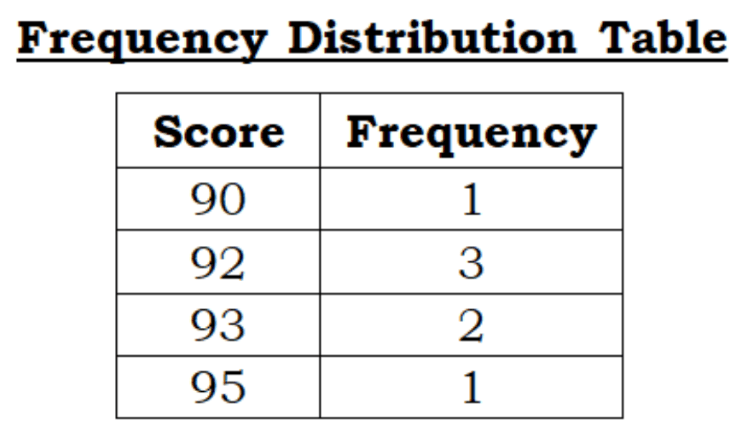
Which data set corresponds to the frequency distribution table shown below?