Loading...

STAAR High School Biology - 2013 Past Paper
Quiz by Biology - Texas Education Agency
Track each student's skills and progress in your Mastery dashboards
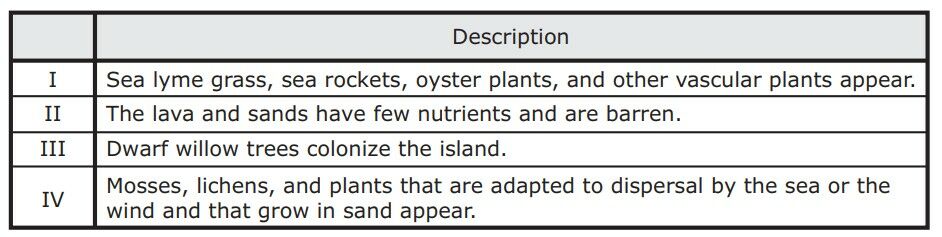
Surtsey is an island located south of Iceland. The island was formed by a volcanic eruption and first appeared in 1963. The table below contains descriptions of changes in the population and diversity of species on Surtsey.
Which of these lists the descriptions in the correct order of ecological succession on Surtsey?

The technique known as chromosome painting is the result of scientific research. Scientists use chromosome painting to mark the locations of genes on human chromosomes with fluorescent tags. It is also possible to apply this technique to the chromosomes of many different species. Chromosome painting allows for which of the following?

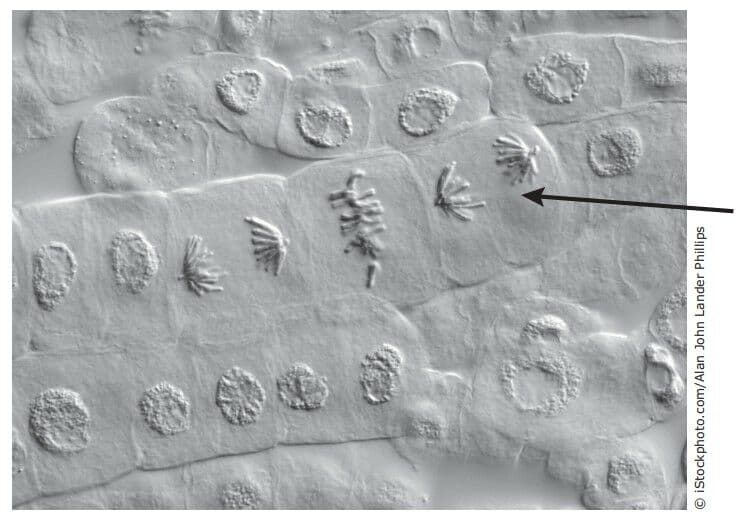
A photomicrograph of onion root tip cells during mitosis is shown below.
Which phase of mitosis is occurring in the cell indicated by the arrow?
A dog’s pituitary gland produces the hormone ACTH, which stimulates the adrenal glands to secrete cortisol. Cortisol helps regulate body weight, mineral balance, the structure of connective tissue, the production of white blood cells, and skin health. When cortisol levels are low, the pituitary gland secretes ACTH. When cortisol levels are high, the pituitary gland stops secreting ACTH. Based on this information, which of the following would most likely be the cause of elevated levels of cortisol in a dog?
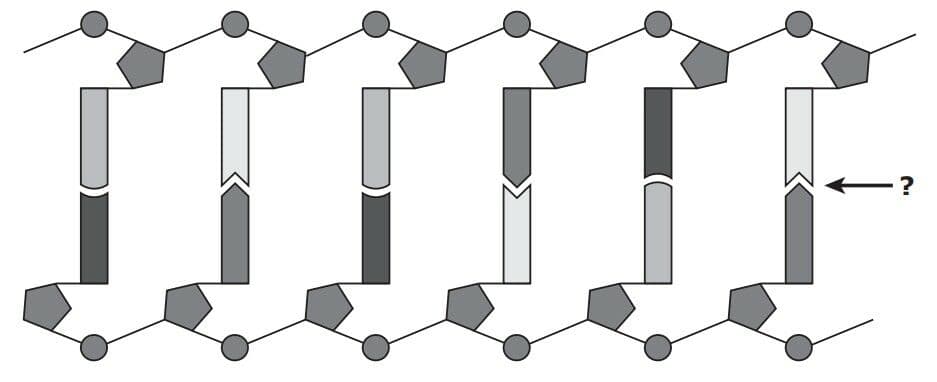
A model of a DNA molecule is shown below.
The arrow indicates -
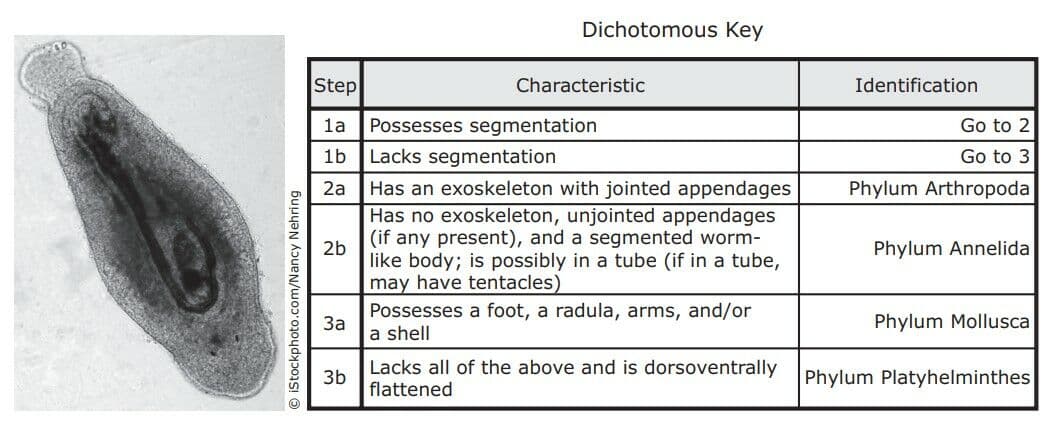
A student collected the animal shown below on a field trip. The student used a dichotomous key and a microscope to classify the animal.
How should this animal be classified?
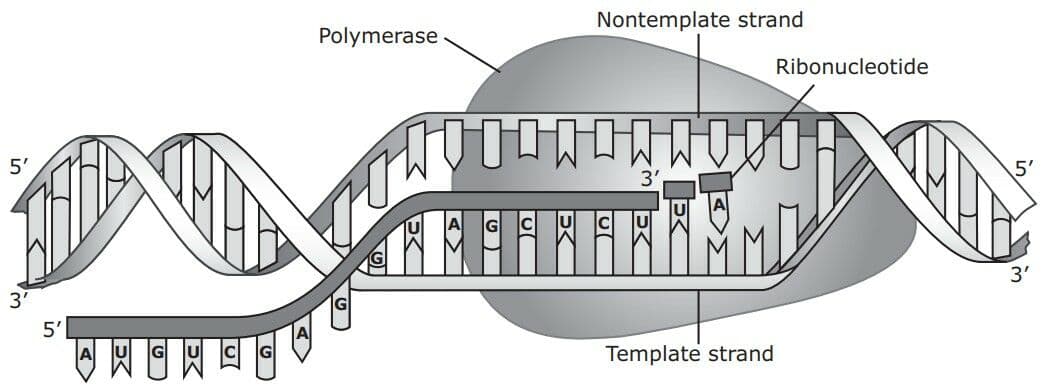
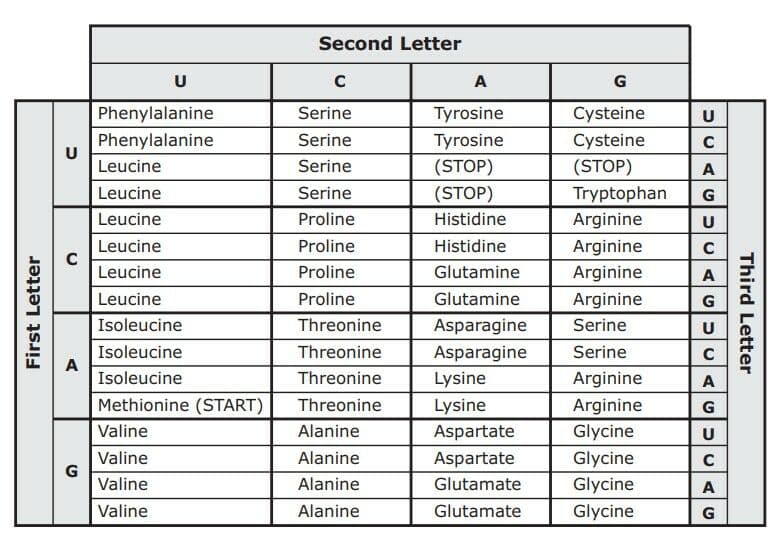
A codon chart is shown below.
Which of these changes to the DNA triplet 3' GCT 5' will affect the protein produced?
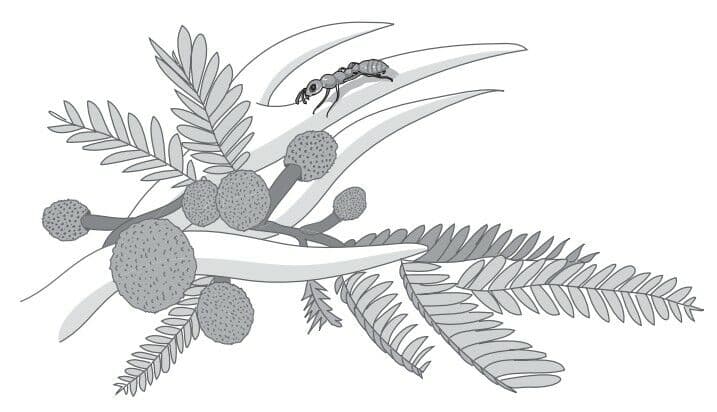
The acacia ant (Pseudomyrmex ferruginea) lives in the bullshorn acacia plant, as shown below.
The acacia ant nests and feeds in the plant's hollow thorns. The ant helps protect the bullshorn acacia by attacking insects and grazing animals that come near the plant. The relationship between the acacia ant and the bullshorn acacia is an example of which of the following?
Zoogeographic regions are characterized by the presence of specific groups of animals. These regions are determined by the taxonomic or phylogenetic relationships of animals. The map shows the zoogeographic regions proposed by the naturalist Alfred Russel Wallace in 1876.
The similarities of organisms in which two areas numbered above provide the best evidence for common ancestry between the organisms in both locations?

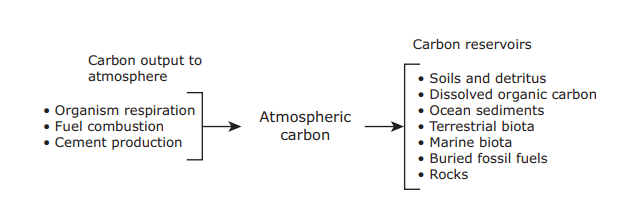
The carbon cycle includes processes that release carbon into the atmosphere and places that act as carbon reservoirs. The diagram below shows both major processes that release carbon and major carbon reservoirs.
Which of these disruptions would cause an excess output in the carbon cycle?
The Nile River flows into the Mediterranean Sea. The Aswan High Dam contains the flow of water from the river and reduces the annual fall flooding. The floodwater is trapped behind the huge dam, allowing irrigation for agriculture. Sediments that would be washed away by the annual floods are also trapped behind the dam. The graph shows the water flow from the Nile that enters the Mediterranean Sea.
How has this dam most likely affected the Mediterranean Sea ecosystem?

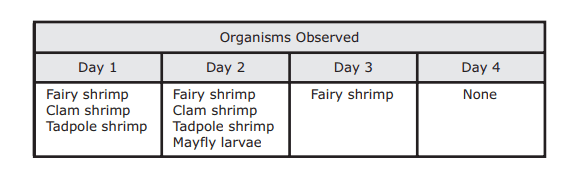
A student is studying the ecology of a playa lake, which forms after a rainfall in a dry lake bed. The table lists the organisms that the student observed.
Which level of biological organization has the student described in the table?
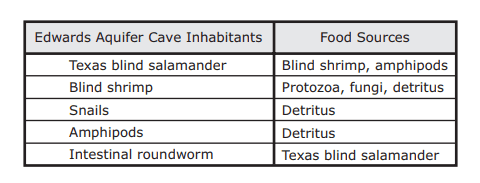
The Texas blind salamander (Eurycea rathbuni) lives in the Edwards Aquifer region around San Marcos. Along with other species the salamander lives in total darkness in the underground crevices and caves of the aquifer region. The table lists some of the organisms that live in this environment and their food sources.
In an energy pyramid for these aquifer cave dwellers, which of the following would be placed at the bottom?
A harmless scarlet king snake and a venomous eastern coral snake have similar band patterns, as shown below. For the scarlet king snake, the adaptation of having a banding pattern like the eastern coral snake's is known as mimicry.
The outcome of this adaptation in the scarlet king snake is to -

The diagram below represents the cell cycle.
When cells leave the cell cycle, they exit during G1 phase and then enter G0 phase, a resting period. Most normal cells can leave G0 phase and reenter the cell cycle at G1 phase before entering S phase. Cancer cells are different because they cannot enter G0 phase and are likely to do which of the following?

The graph shows the basic changes in a forest community after a disturbance occurred.
The information shown in the graph suggests that the changes in the forest community were caused by -

Changes in water pressure within guard cells cause the cells to open or close the stoma. This response helps the plant maintain homeostasis by —
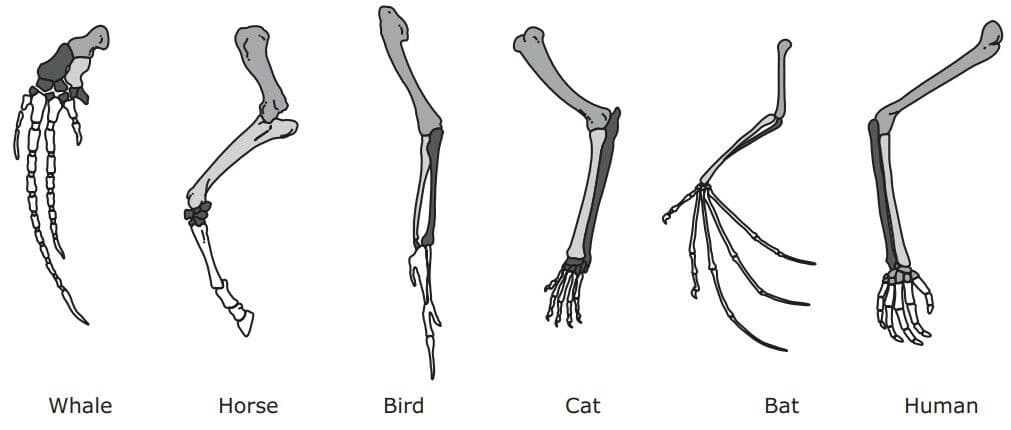
The limbs of several organisms are shown in the illustrations below. Scientists sometimes compare the limbs of these organisms to look for evidence of common ancestry.
These limbs provide evidence of common ancestry because they -
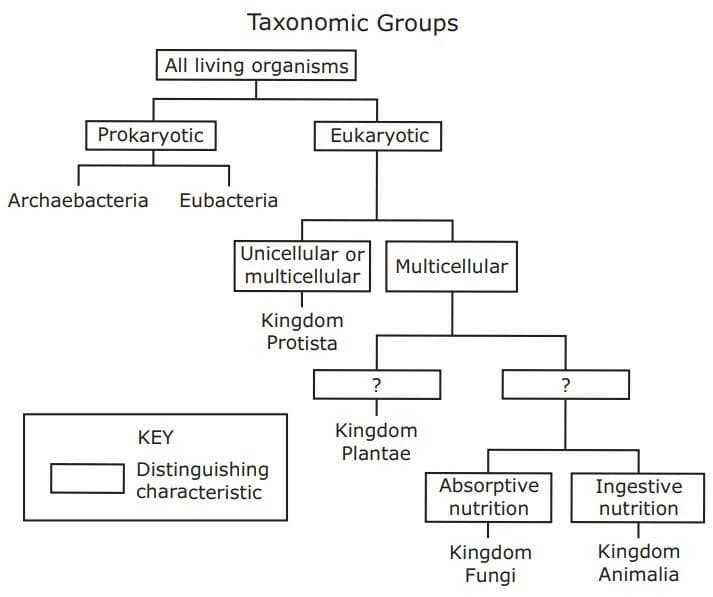
The diagram shows taxonomic groups and a major distinguishing characteristic of all but two of them.
Which characteristics will be used to complete the chart?