
Unit 2 - Scatterplots and Functions Review
Quiz by Cecilia Argueta
Feel free to use or edit a copy
includes Teacher and Student dashboards
Measure skillsfrom any curriculum
Measure skills
from any curriculum
Tag the questions with any skills you have. Your dashboard will track each student's mastery of each skill.
With a free account, teachers can
- edit the questions
- save a copy for later
- start a class game
- automatically assign follow-up activities based on students’ scores
- assign as homework
- share a link with colleagues
- print as a bubble sheet
11 questions
Show answers
- Q1Which of the following does NOT suggest a linear relationship between x and y?45s
- Q2
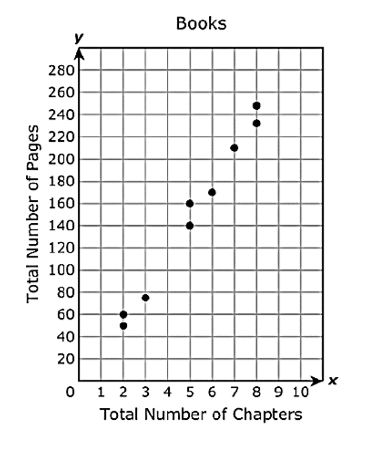
What is the best prediction of the total number of pages in a book with 9 chapters?300 pages270 pages120 pages240 pages120s
- Q3Based on the scatterplot, what is the best prediction of the average number of hours a person spends at work every week if that person spends an average of 20 hours on recreational activities every week?10 h40 h30 h50 h120s
- Q4Based on this scatterplot, about how much money would a group of 12 people be expected to spend on food and beverages at this restaurant?$100$60$120$150120s
- Q5Based on the scatterplot, which is the best prediction of the number of points scored by a student who spends 20 minutes playing the video game?300600900450120s
- Q6What correlation is happening on the scatterplot below?Positive associationNo apparent associationNegative association120s
- Q7What correlation is happening on the scatterplot below?As calls increase everything increases.As calls decrease everything decreases.No relationship between cost of call and length of call.120s
- Q8A relation contains the points (2, 1), (3, –2), (4, 1), (5, 2), and (6, –2). Which statement accurately describes this relation?The relation represents y as a function of x, because each value of x is associated with a single value of y.The relation represents y as a function of x, because each value of y is associated with two values of x.The relation does not represent y as a function of x, because each value of y is associated with two values of x.The relation does not represent y as a function of x, because each value of x is associated with a single value of y.120s
- Q9Which graph represents y as a function of x?120s
- Q10Which set of ordered pairs represents y as a function of x?{(1, 0), (1, 2), (1, –2), (1, 4), (1, –4)}{(0, 0), (–1, 2), (–1, –2), (–2, 4), (–2, –4)}{(0, 0), (1, 1), (2, 4), (4, 9), (4, 16)}{(0, 0), (–1, 2), (–2, –2), (–3, 4), (–4, –4)}120s
- Q11Which statement describes the mapping?The mapping represents y as a function of x, because there are more x-values than different corresponding y-values.The mapping does not represent y as a function of x, because each x-value corresponds to exactly one y-value.The mapping does not represent y as a function of x, because there are more x-values than different corresponding y-values.The mapping represents y as a function of x, because each x-value corresponds to exactly one y-value.120s