solve one- and two-step problems using categorical data represented with a frequency table, dot plot, pictograph, or bar graph with scaled intervals
Track each student's skills and progress in your Mastery dashboards
Loading...
Loading...
Give this quiz to my class
Q 1/2
Score 0
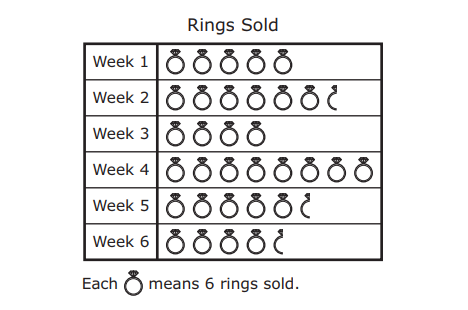
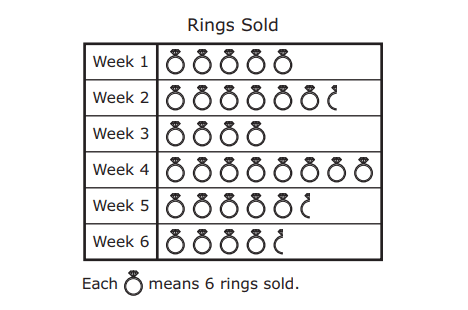
The graph shows the number of rings Mrs. Adams sold during six weeks at her jewelry store. What is the total number of rings Mrs. Adams sold during weeks 4, 5, and 6? Be sure to use the correct place value.
60
102
88
108
96
Q 2/2
Score 0
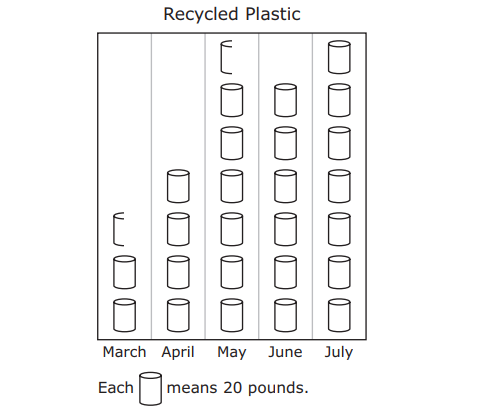
The graph below shows the number of pounds of plastic the Keller family recycled for five months. Based on the graph, how many more pounds of plastic did the family recycle in July than in April? Record your answer and fill in the bubbles on your answer document. Be sure to use the correct place value.
60
80
20
60
40
2 questions
Q.
The graph shows the number of rings Mrs. Adams sold during six weeks at her jewelry store. What is the total number of rings Mrs. Adams sold during weeks 4, 5, and 6? Be sure to use the correct place value.
1
60 sec
3.8.B: Data Analysis
Q.
The graph below shows the number of pounds of plastic the Keller family recycled for five months. Based on the graph, how many more pounds of plastic did the family recycle in July than in April? Record your answer and fill in the bubbles on your answer document. Be sure to use the correct place value.