Loading...
AP Bio TOPIC 8 QUIZ
Quiz by Sal Veltri
Tag the questions with any skills you have. Your dashboard will track each student's mastery of each skill.
The population of Japanese sika deer in central Japan was determined each year from 2005 to 2014. The sika deer population underwent logistic growth starting at 26,000 deer in 2005 and stabilized at 58,000 deer between 2012 and 2014. Based on these data, the rmax for this population was determined to be 0.57. Central Japan contains a variety of habitats, including forests and grasslands. Sika deer benefit from the resources in grasslands more than forests; if deforestation occurred, producing more grasslands in the region, the carrying capacity for sika deer population would increase.
What would the population size of sika deer be one year after the carrying capacity increased to 70,000 as a result of deforestation? Assume rmax does not change.
A population of 250 birds inhabit the canopy of a tropical rain forest that has a carrying capacity of 400 birds.
What is the maximum population growth rate (rmax) if the population grows to 283 in one year?
A fish population of 250 in a pond has a maximum annual rate of increase of 0.8.
If the carrying capacity of the pond is 1,500 for this species, what is the expected population size after one year?
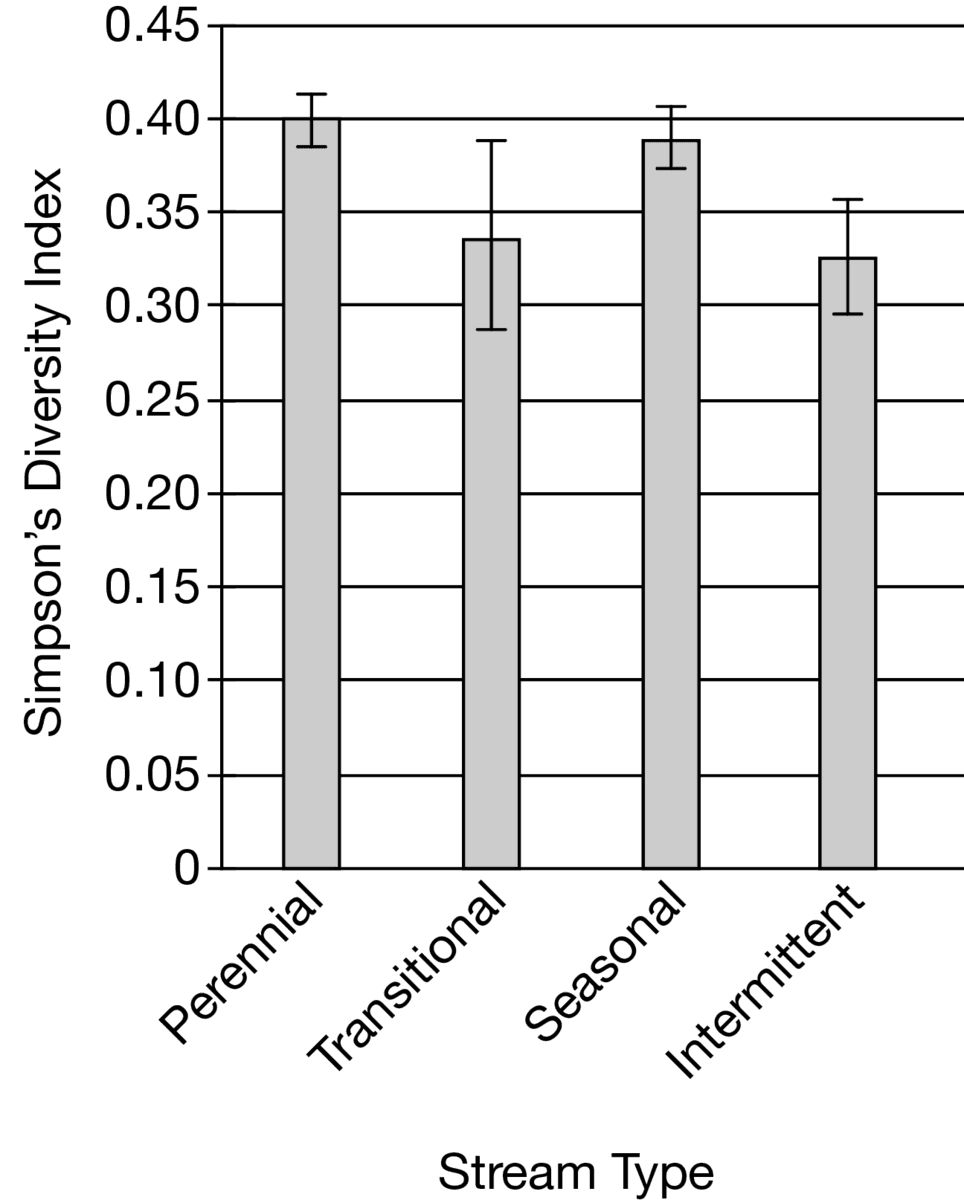
Researchers studied the diversity of macroscopic invertebrates in different areas of watershed ecosystems. They collected samples from 58 sites along 11 streams in the same geographical area. Their data were classified by stream type and can be found in Figure 1. The stream-type classifications range from the perennial stream type, which always has water, to the intermittent stream type, which is dry for more than nine months during the year.
Figure 1. Diversity of macroscopic invertebrates in different stream types. Error bars represent a 95% confidence interval (two Standard Errors from the mean).
Which of the stream types had a statistically lower macroscopic invertebrate species diversity than the seasonal streams?
Interactions among populations determine how they access resources within a community. In Costa Rica, two different species of mites, Rhinoseius colwelli and Rhinoseius richardsoni, exhibit a high degree of interspecies competition. Both mite species live within the flowers of plants, and adult male mites tend to kill mites if they belong to a different species. An experiment was carried out to determine whether these aggressive interactions have resulted in niche partitioning by R. colwelli and R. richardsoni, of different flower species, with each mite species living in different plant species. The results are summarized in Figure 1.
Figure 1. Mite Habitat Preferences
Which of the following is an accurate interpretation of the data in Figure 1 ?

In the Florida Everglades, Burmese pythons are an invasive species. They were introduced into southern Florida in 1992. These pythons feed on many of the native Florida species, establishing the pythons as the top predator in the environment. By the year 2000, their population had increased dramatically.
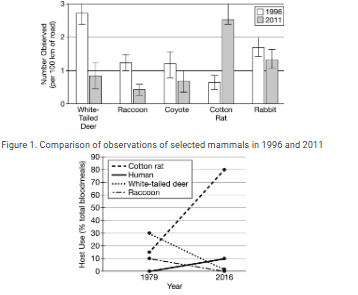
Figures 1 and 2 display data collected by ecologists studying the results of the Burmese python invasion. Figure 1 shows counts of animals collected from nighttime road surveys in southern Florida, which are used to estimate population size. Figure 2 shows data collected from mosquitoes captured from the wild. DNA sequencing was used to identify the species of blood that the mosquitoes had in their stomachs, identifying various hosts used by the mosquitoes.
Figure 1. Comparison of observations of selected mammals in 1996 and 2011
Figure 2. Change in host preference by Culex cedecei between 1979 and 2016. Numbers do not add up to one hundred percent because these represent a subset of all the host species.
In 1996, the native Culex cedecei mosquitoes in southern Florida preferentially took blood meals from white-tailed deer and raccoons. It was predicted that changes in host population size would alter these host preferences. Additionally, it is known that cotton rats are often infected by the Everglades virus, which normally exists in animals, but is capable of infecting humans. Ecologists predict that increased feeding on cotton rats by C. cedecei may significantly increase the tendency of this virus to infect humans.
Which of the following populations have significantly decreased in size between 1996 and 2011 ?

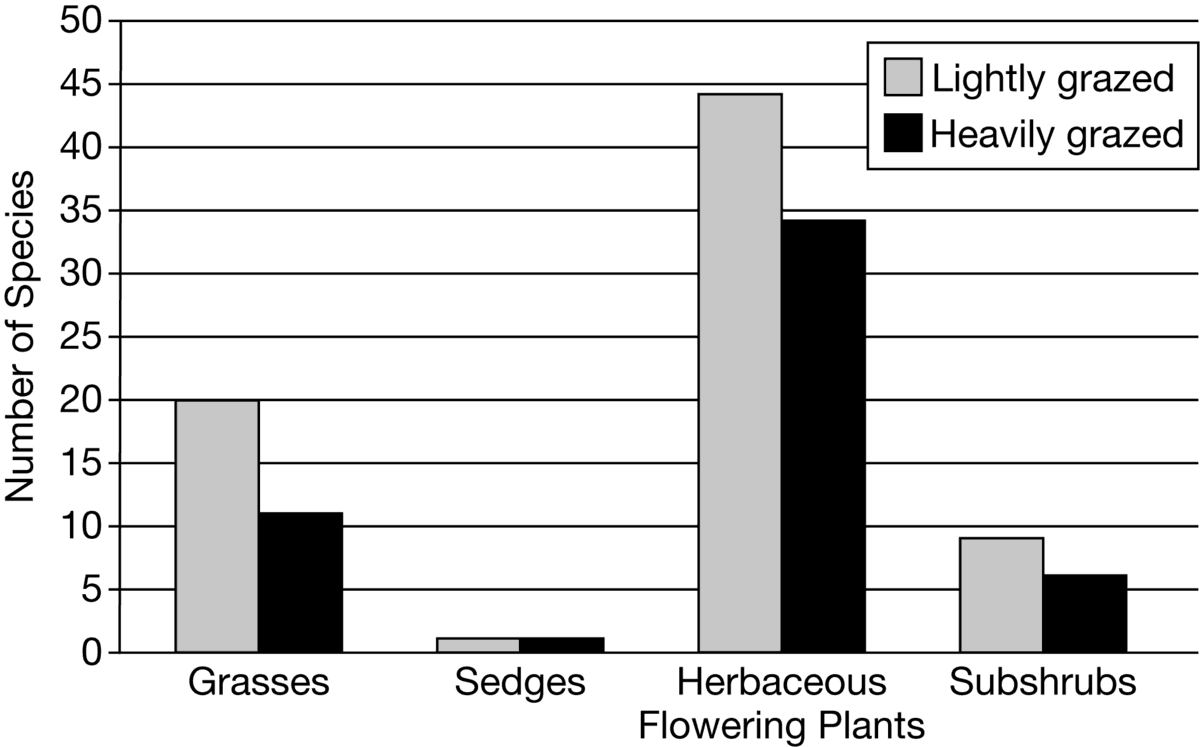
Researchers were studying species diversity in a savanna rangeland community in southwest Queensland, Australia. Researchers counted the numbers of plants species in four different categories at two nearby sites within the savanna rangeland; one lightly grazed by herbivores and one heavily grazed by herbivores (Figure 1).
Figure 1. Plant species richness in lightly and heavily grazed savanna communities.
Which of the following best predicts the results of a drought in the savanna research area with regards to community resilience to this environmental change?
In the Florida Everglades, Burmese pythons are an invasive species. They were introduced into southern Florida in 1992. These pythons feed on many of the native Florida species, establishing the pythons as the top predator in the environment. By the year 2000, their population had increased dramatically.
Figures 1 and 2 display data collected by ecologists studying the results of the Burmese python invasion. Figure 1 shows counts of animals collected from nighttime road surveys in southern Florida, which are used to estimate population size. Figure 2 shows data collected from mosquitoes captured from the wild. DNA sequencing was used to identify the species of blood that the mosquitoes had in their stomachs, identifying various hosts used by the mosquitoes.
Figure 1. Comparison of observations of selected mammals in 1996 and 2011
Figure 2. Change in host preference by Culex cedecei between 1979 and 2016. Numbers do not add up to one hundred percent because these represent a subset of all the host species.
In 1996, the native Culex cedecei mosquitoes in southern Florida preferentially took blood meals from white-tailed deer and raccoons. It was predicted that changes in host population size would alter these host preferences. Additionally, it is known that cotton rats are often infected by the Everglades virus, which normally exists in animals, but is capable of infecting humans. Ecologists predict that increased feeding on cotton rats by C. cedecei may significantly increase the tendency of this virus to infect humans.
Which of the following most accurately explains an impact of Burmese pythons on the Everglades community in southern Florida using the data provided?
In the Florida Everglades, Burmese pythons are an invasive species. They were introduced into southern Florida in 1992. These pythons feed on many of the native Florida species, establishing the pythons as the top predator in the environment. By the year 2000, their population had increased dramatically.
Figures 1 and 2 display data collected by ecologists studying the results of the Burmese python invasion. Figure 1 shows counts of animals collected from nighttime road surveys in southern Florida, which are used to estimate population size. Figure 2 shows data collected from mosquitoes captured from the wild. DNA sequencing was used to identify the species of blood that the mosquitoes had in their stomachs, identifying various hosts used by the mosquitoes.
Figure 1. Comparison of observations of selected mammals in 1996 and 2011
Figure 2. Change in host preference by Culex cedecei between 1979 and 2016. Numbers do not add up to one hundred percent because these represent a subset of all the host species.
In 1996, the native Culex cedecei mosquitoes in southern Florida preferentially took blood meals from white-tailed deer and raccoons. It was predicted that changes in host population size would alter these host preferences. Additionally, it is known that cotton rats are often infected by the Everglades virus, which normally exists in animals, but is capable of infecting humans. Ecologists predict that increased feeding on cotton rats by C. cedecei may significantly increase the tendency of this virus to infect humans.
Based on the data, which of the following most accurately matches a potential change with its predicted effects on the southern Florida ecosystem?

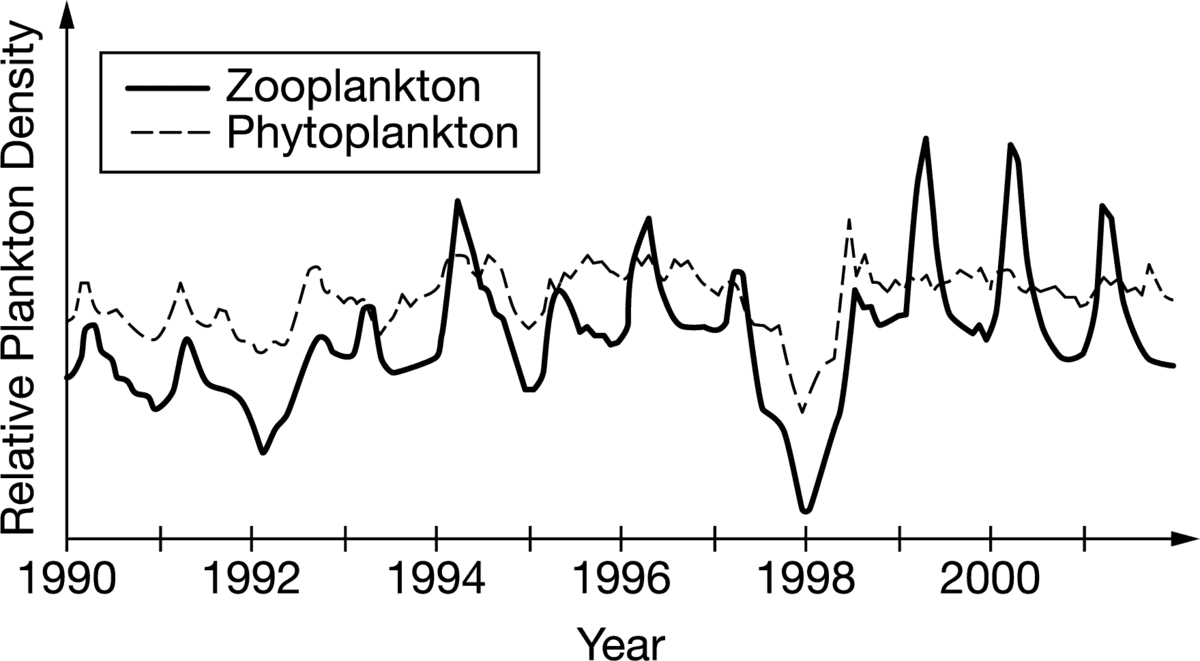
Phytoplankton (dashed line) are important because they occupy the bottom of the food web absorbing , functioning as a carbon sink. A scientist suggests that an El Niño event in early 1998 caused a significant decrease in the abundance of phytoplankton that year in the equatorial Pacific Ocean.
Figure 1. Relative abundance of plankton over time in the eastern equatorial Pacific Ocean
Which of the following observations would best support this alternative hypothesis?
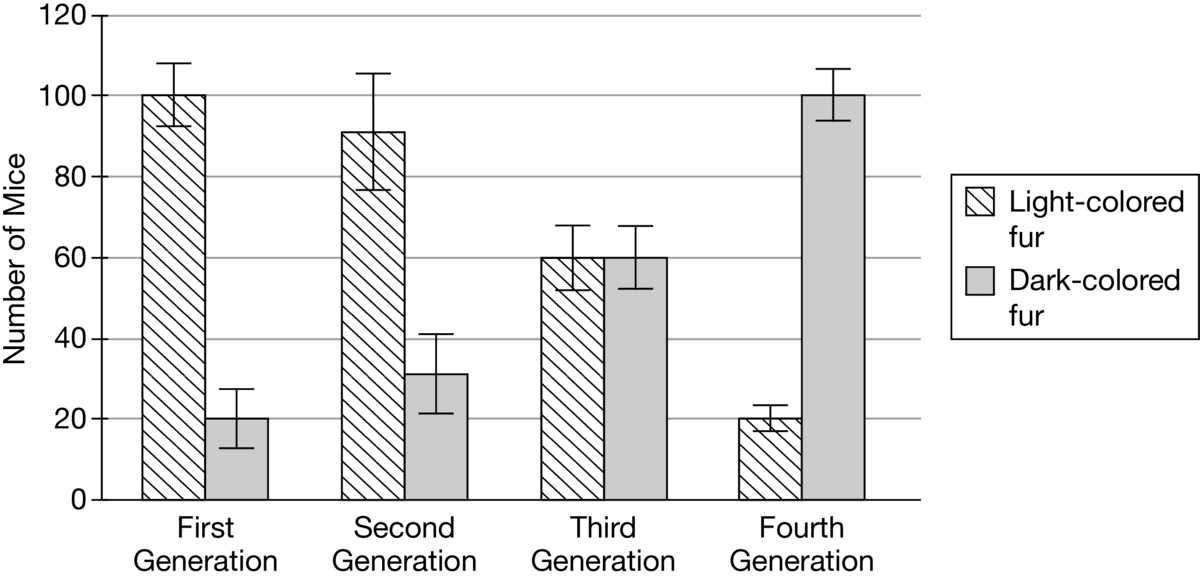
Fur color is a genetically controlled trait in mice. A population of a species of mouse that typically lives in habitats with light-colored soil was studied for several generations. The background color of the habitat of this population became darker after the second generation due to human activity. A researcher sampled approximately 120 mice in each generation and recorded the fur color phenotypes as shown in Figure 1.
Figure 1. Fur color phenotype distribution of mice over four generations
The researcher claims that there is no selective advantage to fur color, so light and dark fur color phenotypes are present in similar frequencies in the fourth generation of this mouse population. Based on the data in Figure 1, which of the following best evaluates this null hypothesis?
Zebra mussels are an invasive species that has become widely established throughout the United States. Figure 1 shows the percent change in the population sizes of selected groups of organisms in the Hudson River since the introduction of zebra mussels. In this study chlorophyll-containing bacteria are considered phytoplankton and all other bacteria are considered bacterioplankton.
Figure 1. Change in biomass of selected Hudson River organisms after the introduction of zebra mussels
Which of the following hypotheses about the effect of zebra mussels on the Hudson River community is best supported by the data in Figure 1 ?

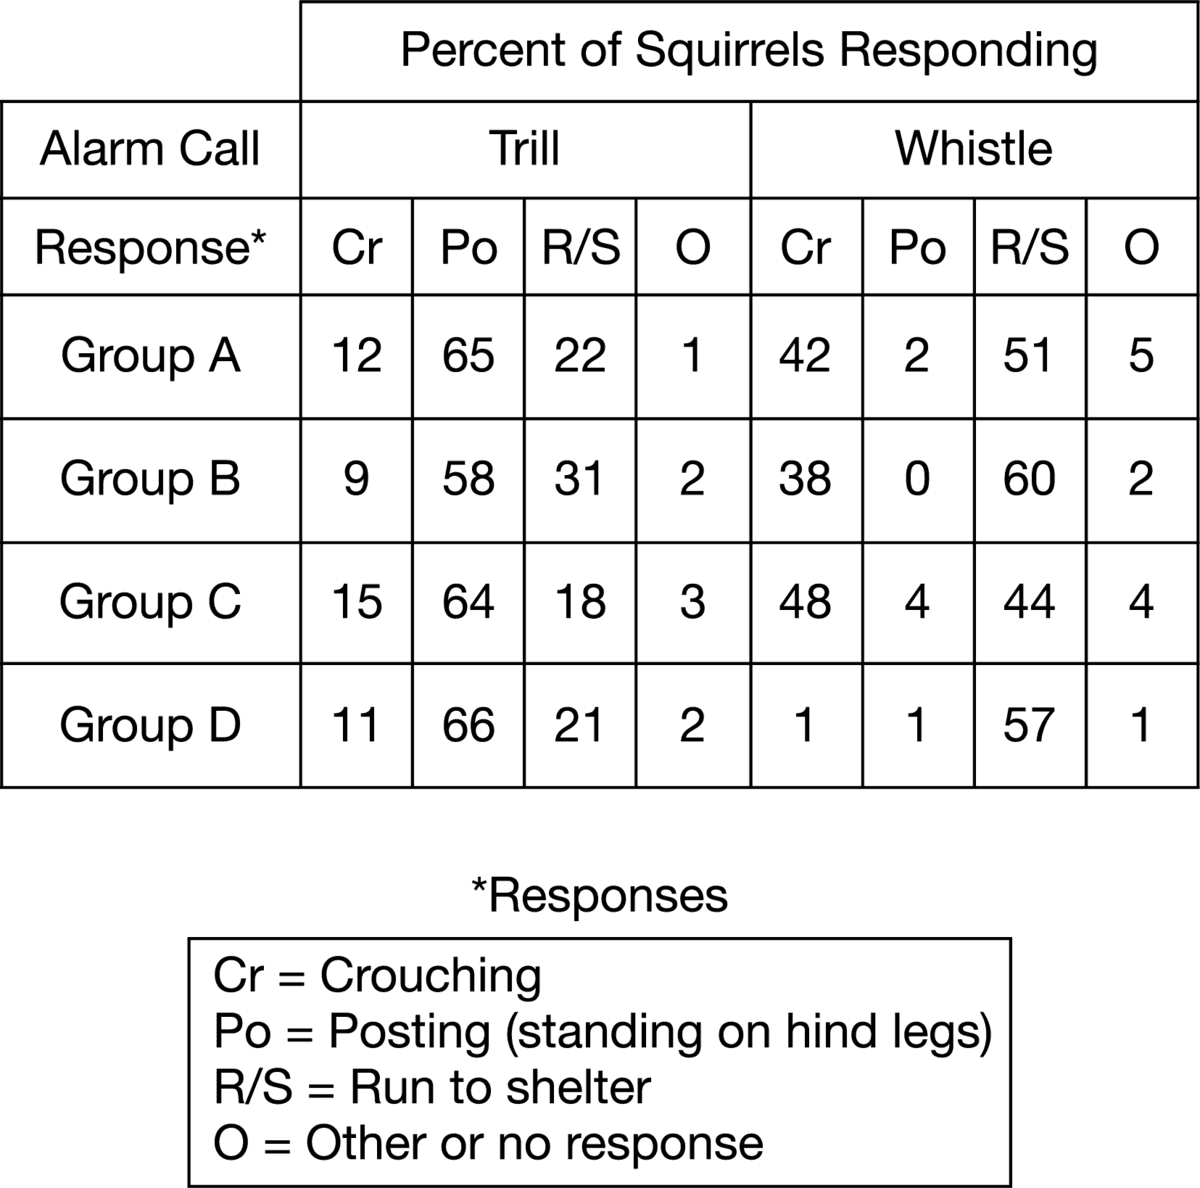
Scientists are studying the two primary vocalizations made by Belding’s ground squirrels (Urocitellus beldingi). The trill call consists of a series of medium-pitched notes given rapidly, while the whistle call consists of a single high-pitched note. The objective of the experiment is to determine the function of each vocalization. Recordings of the calls were played to four different groups of squirrels, and the response of each individual squirrel was documented. The responses are summarized in Table 1.
Which of the following correctly identifies the dependent variable and the independent variable for the experiment?
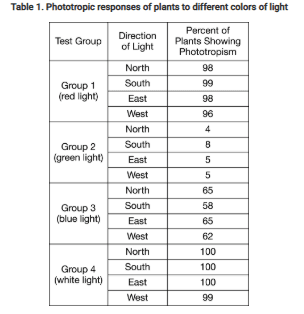
A group of biologists were investigating the effects of light color on phototropism (growing toward the light source) in tomato plants. Four groups of tomato plants were grown in the same greenhouse under identical conditions. Each group was then placed in a different room, each room having a different color of light, exposed to that single color of light from different directions for one week at a time. After each week, the biologists counted the number of tomato plants in the groups that were showing evidence of phototropism. The results are summarized in Table 1.
Which of the following correctly identifies the dependent and independent variables in this experiment?
Quorum sensing is a form of cell-to-cell communication used by some bacterial species to regulate their behavior and population size. Staphylococcus aureus uses quorum sensing to activate its virulence genes once its population reaches a minimum size. Virulence refers to the ability of a pathogen to cause disease.
S. aureus secretes autoinducing peptide (AIP), which binds to the AgrC receptor on the bacterial cell membrane. When the S. aureus population is sufficiently large and produces enough AIP, this concentration activates AgrC and stimulates a signal cascade resulting in the production of hemolysin, a toxin used to attack the host organism. In order to lessen the impact of the toxin produced by an S. aureus infection on patients, scientists created AIP mimics intended to act as competitive inhibitors of AIP -- AgrC binding at the cell surface.
Figure 1. AIP cascade producing hemolysin toxin
Identify the experimental design that would determine which AIP mimic would most effectively inhibit the production of hemolysin toxin.

The deep ocean floor communities contain very little life. In constant darkness, the water at these depths hovers around 2*C. Sparsely distributed in this environment are hydrothermal vent ecosystems. Superheated water streams out of the vents at temperatures approaching 400*C. These waters are rich in inorganic materials, including carbon dioxide and hydrogen sulfide. Hydrothermal vent zones have a density of organisms 10,000 to 100,000 times greater than found on the surrounding seafloor.
Scientists have studied these vents to determine the energy source for these communities and the identity of the primary producers in the perpetual darkness of the ocean floor. As expected, they found a total absence of photosynthetic organisms at all vents, identifying mats of bacteria as the producers of the carbon compounds that are used by the rest of the community for growth, repair, and as an energy source.
Which of the following describes how the vent bacteria harvest energy to produce organic compounds for use by the vent community?
A student created a terrarium by placing soil in the bottom of a large glass container. He added several species of mosses and tiny grasses to the soil. The student ensured that the soil and plants were damp by adding water from a nearby creek. He added a few dead, decaying leaves and twigs, some small insects, and a few small garden slugs to the terrarium. He placed an airtight seal on the container and placed the container near a window where it would receive some sunlight but would not overheat. After three years, the terrarium still contains living organisms.
Which of the following statements best explains how this terrarium could sustain living organisms for three years?
In an experiment, three different animals were exposed to a series of environmental temperatures and their body temperatures were assessed at multiple temperature points between 10 and 40 degrees Celsius. Ten different individuals of each type of animal were included in the study to produce an average body temperature profile for each type of animal. Figure 1 shows the data collected.
Figure 1. Effect of environmental temperature on body temperature of selected animals
Which of the following statements is most consistent with the data in Figure 1 ?

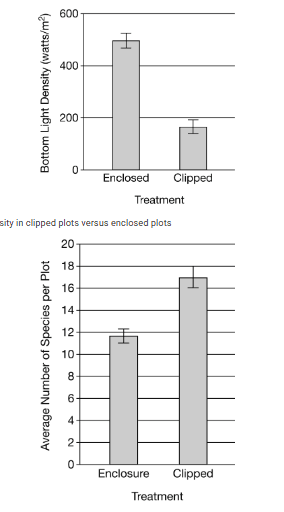
In an experiment to determine the effect of light availability on species richness in an environment, a grassland was divided into 26 plots that were assigned to one of two treatment groups:
1. Clipped – plots were mowed to simulate the grazing of herbivores that maintain the low height of grasses.
2. Enclosure – plots were enclosed in fences, and grasses were allowed to grow undisturbed to their maximum height.
After eight years, data was collected on the amount of light penetration to the soil (bottom light density) and the number of species in the two treatment groups. Figure 1 shows the averaged light penetration measurements, and Figure 2 shows the averaged number of species per plot type.
Figure 1. Average bottom light intensity in clipped plots versus enclosed plots
Figure 2. Richness comparison of two treatments
Which of the following statements is consistent with the data shown in the figures?
An ecologist collected a large sample of forest soil and distributed it evenly into two samples, sample A and sample B. Sample A was placed in a temperature control chamber that was maintained at the forest’s average high temperature. Sample B was placed in a separate temperature control chamber that was maintained at 5*C above the forest’s average high temperature. Both samples were kept in their chambers for 60 days and were watered with only enough sterile water to keep the soil moist. After 60 days, soil from both samples was removed and tested for ammonia levels. Results are shown in Table 1.
Table 1. Ammonia Levels (mg / kg, +/- 2SEz
Sample A | Sample B
11.4 * 0.7 | 3.3 * 0.4
Which of the following is the best explanation of the ammonia level in sample B shown in Table 1?
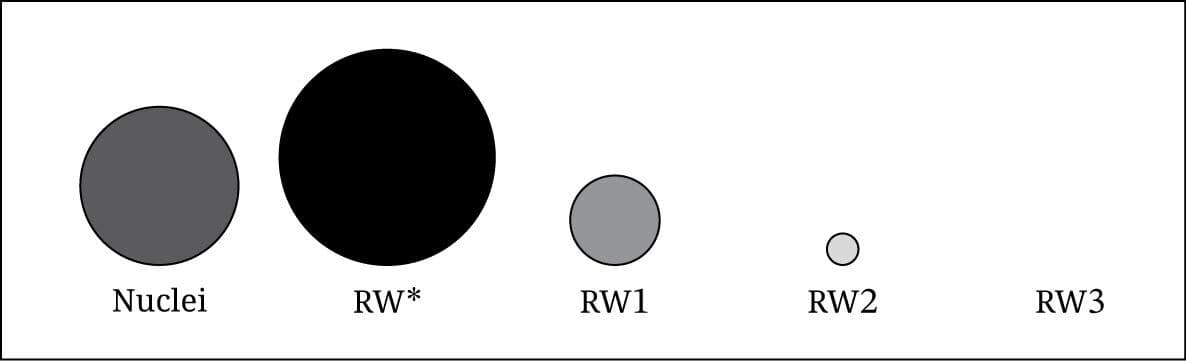
A researcher conducted an experiment in a brightly lit aquarium containing a large population of single-celled green algae. Water containing radioactive phosphorus was added to the aquarium. After 7 days, the researcher took a water sample containing the algae and separated the algae from the radioactive water (RW*).
The researcher added deionized water to rinse the algae and saved the rinse water and then repeated that process twice. The rinse water from each of the three rinses was saved as RW1, RW2, and RW3, respectively. The researcher also removed and kept the nuclei of the algal cells. The nuclei were mixed with deionized water, and a drop of the mixture was placed on a piece of filter paper. A drop of the radioactive water and a drop of each of the rinse water samples were also placed on the same paper. These samples were exposed to X-ray to determine their radioactivity. The results after 24 hours are shown in Figure 1.
Figure 1. Radioactivity of saved algal water samples. Darker color and larger circle size indicate a higher level of radioactivity.
Based on Figure 1, which of the following statements best explains why the nuclei sample had a higher level of radioactivity than any of the rinse water samples?