Loading...
April 22 Problem Set TEKS 3.8A Summarizing Data
Quiz by Dr. Nnenna Wilson, MPH, Ph.D.
Track each student's skills and progress in your Mastery dashboards
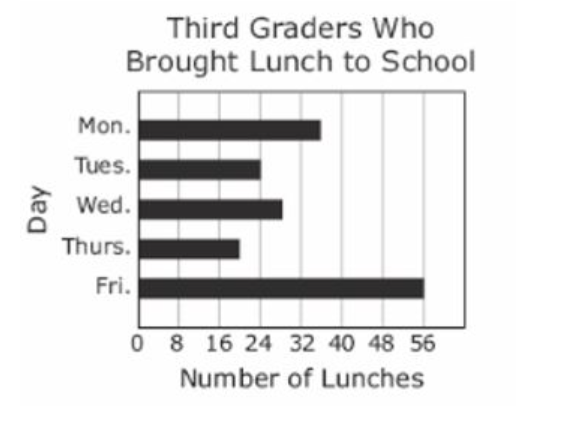
The bar graph shows the number of third graders who brought lunch to school each day last week.
Which table best represents the data in the graph?


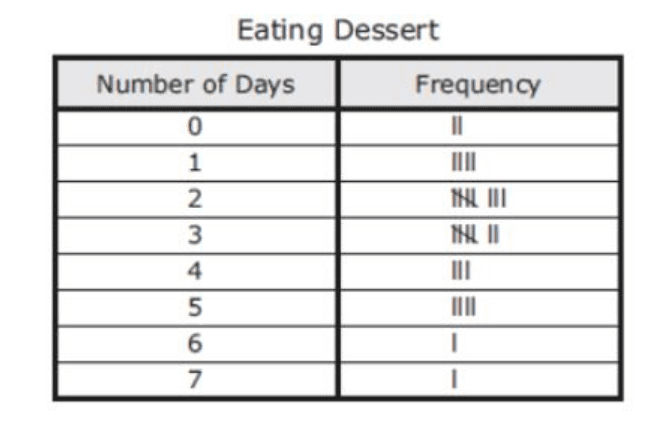
The frequency table shows the results of a survey about how many days per week some families eat dessert.
Which dot plot represents the data in the table?


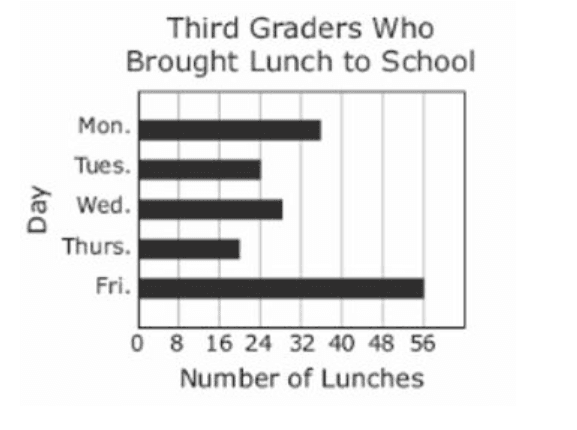
The bar graph shows the number of third graders who brought lunch to school each day last week.
Which table best represents the data in the graph?
The frequency table shows the results of a survey about how many days per week some families eat dessert.
Which dot plot represents the data in the table?
The list shows the number of pounds Henry’s dog ate in three weeks.
*Week 1: 20 pounds
*Week 2: 12 pounds
*Week 3: 16 pounds
Which pictograph best represents the information listed?
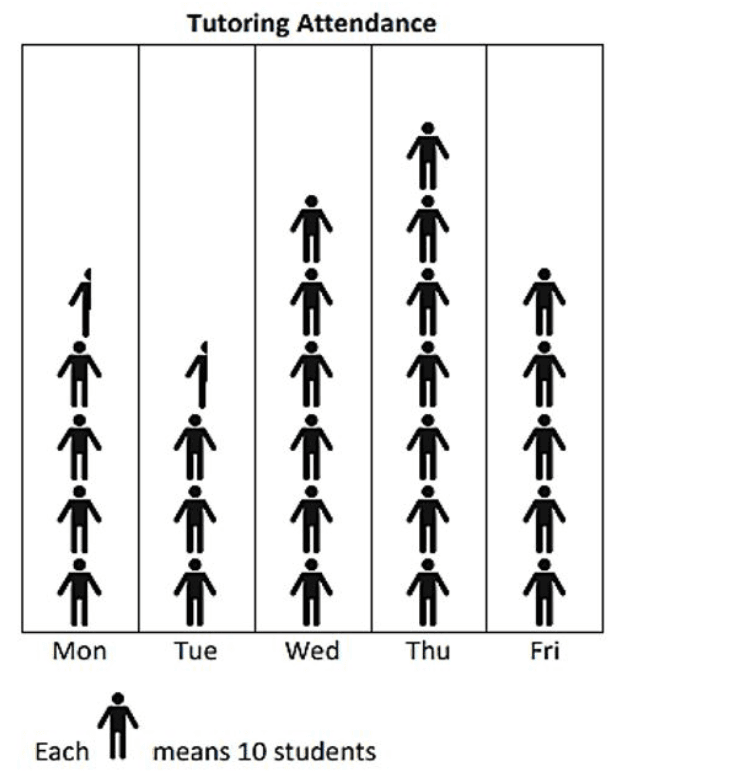
The bar graph shows the number of students who attended tutoring for one week.
Based on the graph, how many more students attended tutoring on Thursday than Friday?