Loading...

Data Vocabulary 3.8AB
Quiz by Toni Cherry
Track each student's skills and progress in your Mastery dashboards
What is the best vocabulary word to describe this picture?
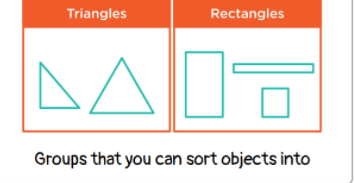
categories
multiplication
dot plot
data
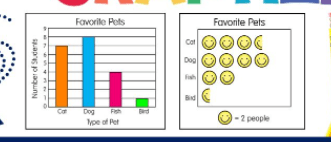
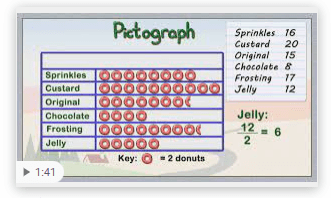
What type of graph is shown?
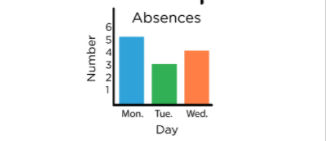
dot plot
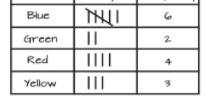
table
bar graph
data graph
What is the best vocabulary word to describe this picture?

What type of graph is shown?

What vocabulary word matches the definition?

What type of marks are shown in the middle column?
Choose the best definition below for a dot plot.

Which definition below best tells the meaning of scaled intervals?

Which vocabulary word matches the definition below?
Choose the picture that best illustrates the definition.

Which definition best matches the picture below?

What main category is used to sort the objects?

What part of the graph below explains the amount of each donut pictured?
Which type of graph is NOT pictured below?