Loading...

NY Released Regents Exam - Earth Science (Aug 2018)
Quiz by NYSED Earth Science
Track each student's skills and progress in your Mastery dashboards
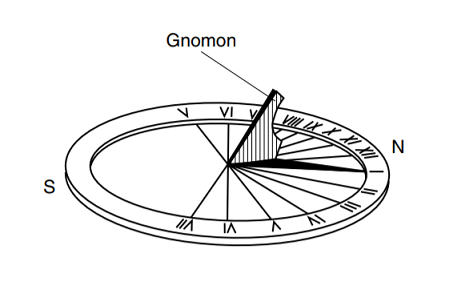
The diagram below represents a sundial positioned in New York State. During daylight, the shadow cast by the gnomon (pointer) moves across the disc, with the tip of the shadow pointing to the time of day.
This motion of the gnomon's shadow on the sundial is mainly due to
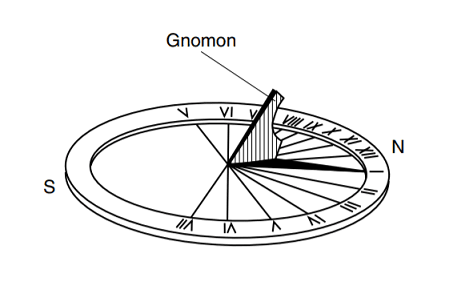
The diagram below represents a sundial positioned in New York State. During daylight, the shadow cast by the gnomon (pointer) moves across the disc, with the tip of the shadow pointing to the time of day.
This motion of the gnomon's shadow on the sundial is mainly due to
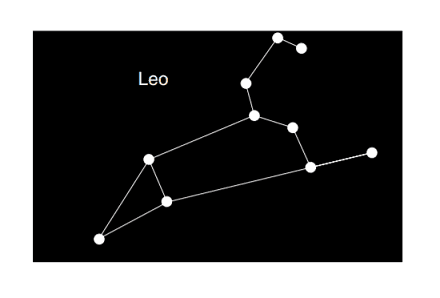
The diagram below represents the constellation Leo that can be seen by an observer in New York State at midnight during March.
Leo is not visible to this observer at midnight during September because
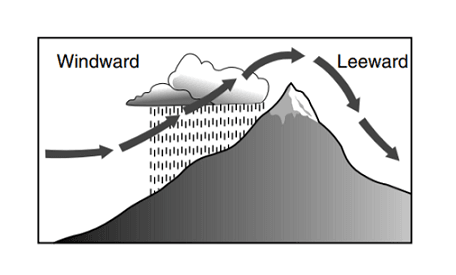
The arrows in the diagram below represent the movement of air over a mountain.
Clouds are forming on the windward side of this mountain because the air is
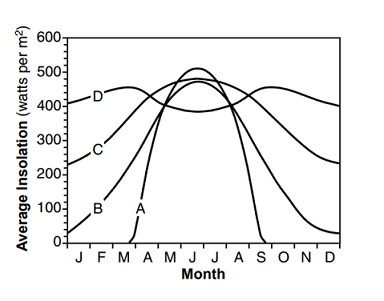
The graph below shows the average monthly amount of insolation received throughout a year at four locations (A, B, C, and D) on Earth.
Which line on the graph best represents the average monthly insolation received at the equator?
The photograph below shows a New York State index fossil.
What is the best classification of this fossil, and during which geologic time period did the organism that produced this fossil exist?

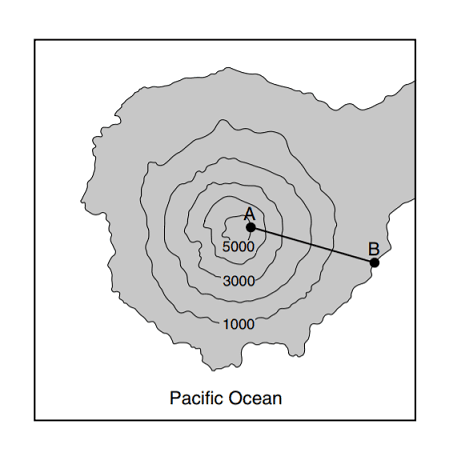
The topographic map below shows a portion of a volcanic island in the Pacific Ocean. Elevations are shown in feet. Letters A and B represent locations on Earth's surface. Locations A and B are 2.5 miles apart.
What is the approximate gradient from point A to point B on the island?
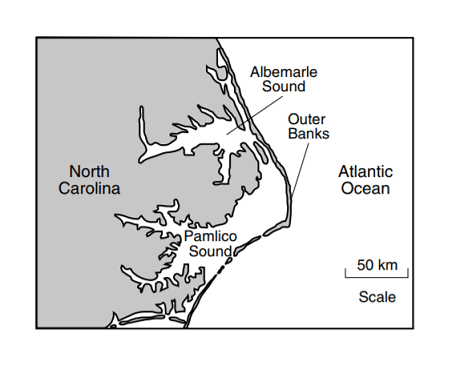
The map below shows a portion of the North Carolina coastline, including some of the Outer Banks. The Outer Banks is a string of narrow barrier islands consisting of well-sorted sand along the Atlantic Ocean coast.
Which agent of erosion is primarily responsible for the formation of these barrier islands?
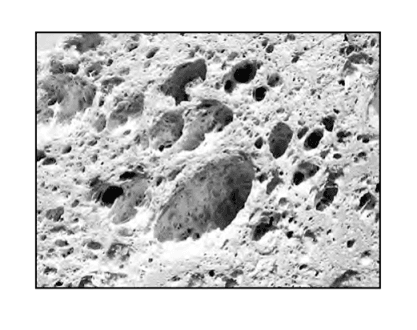
The photograph below shows a magnified view of a portion of a rock that can float if placed in water.
Which terms best describe this rock?
The map below shows three locations, labeled A, X, and B, on Earth's surface.
Which table correctly indicates the solar times at locations A and B when it is 12 noon at location X?

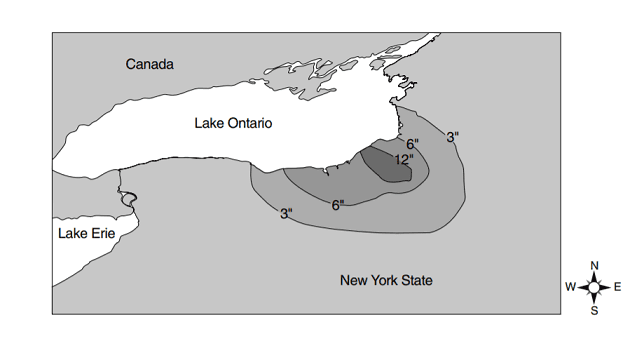
The isolines on the map below show snowfall totals from a lake-effect storm that affected a portion of New York State.
The surface winds that produced this storm came from which direction?
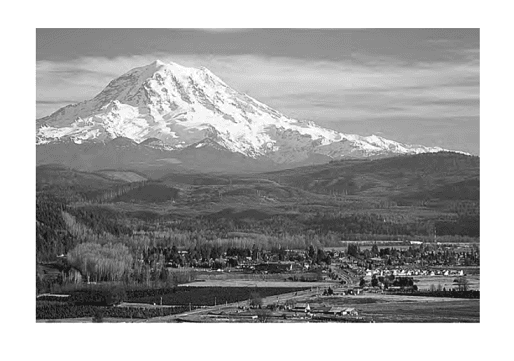
The photograph below shows Mount Rainier, a volcano in the state of Washington.
Which map best shows the complete stream drainage pattern for this mountain?
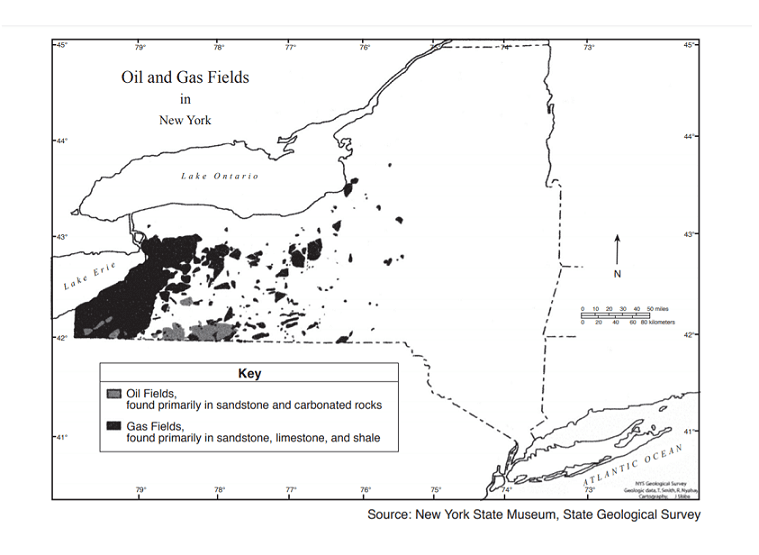
The map below shows the locations of some oil and gas fields in New York State.
Which type of bedrock contains these oil and gas deposits?
Base your answers to questions 36 through 38 on the map below and on your knowledge of Earth science. The map shows typical weather systems over North America. Letters X, Y, and Z represent locations on the map. The isobars on the map are measured in millibars (mb).
Which map information indicates that the wind velocity is greater at location Z than at location X?
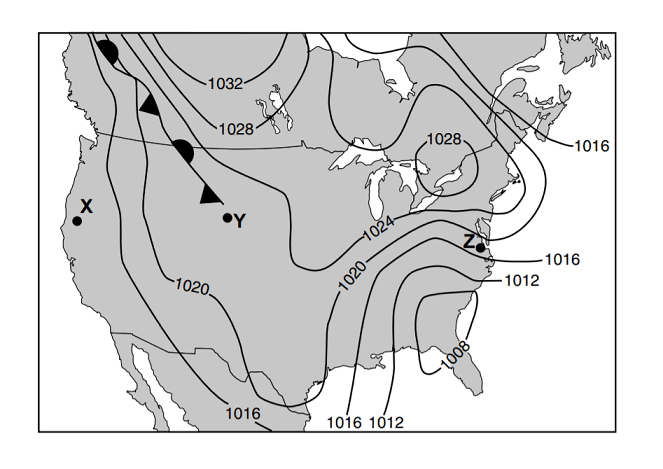
The map shows typical weather systems over North America. Letters X, Y, and Z represent locations on the map. The isobars on the map are measured in millibars (mb).
Which type of front extends northwest from location Y?

The map shows typical weather systems over North America. Letters X, Y, and Z represent locations on the map. The isobars on the map are measured in millibars (mb).
Which map best shows the locations for the centers of high pressure (H) and low pressure (L)?

Supermoon Eclipse
On September 27, 2015, a rare total lunar eclipse of a supermoon occurred. A supermoon occurs when the entire lighted half of the Moon faces Earth (full Moon phase) and the Moon is at its closest point to Earth in its orbit. At this time, the Moon will appear 14% larger and 30% brighter than normal. Supermoon events are rare, but a total lunar eclipse during a supermoon is even more rare. There have been only six total supermoon lunar eclipses since 1900. The next one will not happen until 2033.
Supermoon total lunar eclipses are celestial events that
Supermoon Eclipse
On September 27, 2015, a rare total lunar eclipse of a supermoon occurred. A supermoon occurs when the entire lighted half of the Moon faces Earth (full Moon phase) and the Moon is at its closest point to Earth in its orbit. At this time, the Moon will appear 14% larger and 30% brighter than normal. Supermoon events are rare, but a total lunar eclipse during a supermoon is even more rare. There have been only six total supermoon lunar eclipses since 1900. The next one will not happen until 2033.
The diagram below represents the Moon in four positions, A through D, in its orbit around Earth.
At which position in its orbit was the Moon located during the 2015 supermoon total lunar eclipse?

Supermoon Eclipse
On September 27, 2015, a rare total lunar eclipse of a supermoon occurred. A supermoon occurs when the entire lighted half of the Moon faces Earth (full Moon phase) and the Moon is at its closest point to Earth in its orbit. At this time, the Moon will appear 14% larger and 30% brighter than normal. Supermoon events are rare, but a total lunar eclipse during a supermoon is even more rare. There have been only six total supermoon lunar eclipses since 1900. The next one will not happen until 2033.
The time it took for the Moon to go from this supermoon to the next full moon phase was
The diagram represents a portion of Earth's interior. Letters A, B, and C represent interior layers. The graph shows the velocity of P-waves and S-waves at various depths in Earth's interior.
Which layers of Earth's interior are represented by letters A and B?
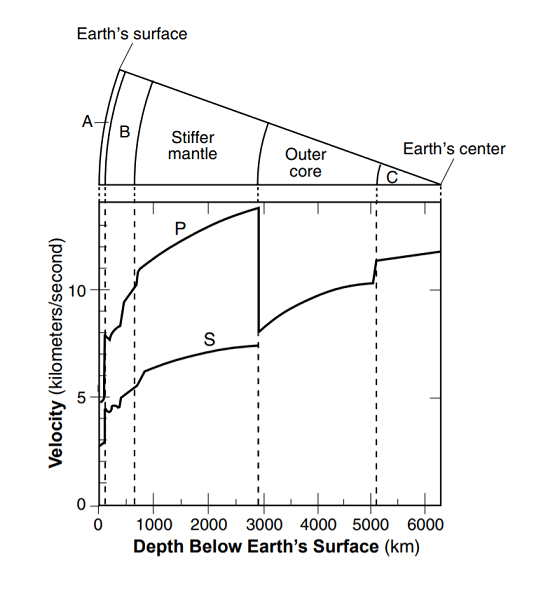
The diagram represents a portion of Earth's interior. Letters A, B, and C represent interior layers. The graph shows the velocity of P-waves and S-waves at various depths in Earth's interior.
What is the approximate velocity in kilometers/second of the P-waves at a depth of 1000 kilometers?

The diagram represents a portion of Earth's interior. Letters A, B, and C represent interior layers. The graph shows the velocity of P-waves and S-waves at various depths in Earth's interior.
Some locations within layer C have an inferred density of

The graph shows the changes in a single star's luminosity and relative temperature from its formation (point 1) to its late stage (point 4) relative to the Sun.
Which is a possible surface temperature of this star at point 2?

The graph shows the changes in a single star's luminosity and relative temperature from its formation (point 1) to its late stage (point 4) relative to the Sun.
Between points 1 and 3, this star is visible to observers on Earth because it emits light energy. This energy is released by the process of nuclear fusion when

The graph shows the changes in a single star's luminosity and relative temperature from its formation (point 1) to its late stage (point 4) relative to the Sun.
Which table correctly classifies this star at points 3 and 4?

The photograph shows a meandering stream in a wooded area. Points A and B represent locations on the streambanks. Letter X represents a flat area near the stream.
The streambank at location B is steeper than the streambank at location A because the water near location B is moving

The photograph shows a meandering stream in a wooded area. Points A and B represent locations on the streambanks. Letter X represents a flat area near the stream.
The area labeled letter X represents a portion of a
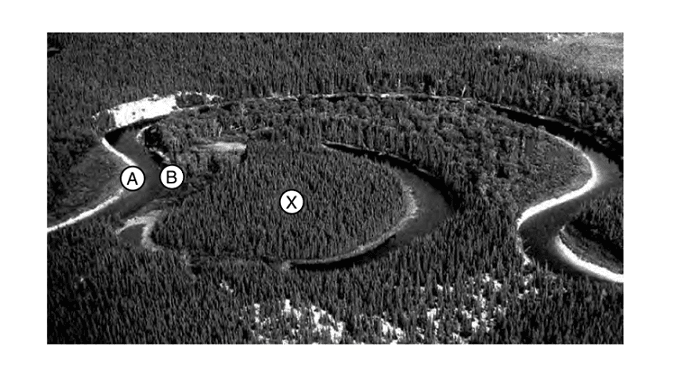
The photograph shows a meandering stream in a wooded area. Points A and B represent locations on the streambanks. Letter X represents a flat area near the stream.
Most of the particles deposited where the stream velocity decreases from 50 centimeters per second to 5 centimeters per second are
