Loading...

NY Released Regents Exam - Earth Science (Jun 2025)
Quiz by NYSED Earth Science
Tag the questions with any skills you have. Your dashboard will track each student's mastery of each skill.
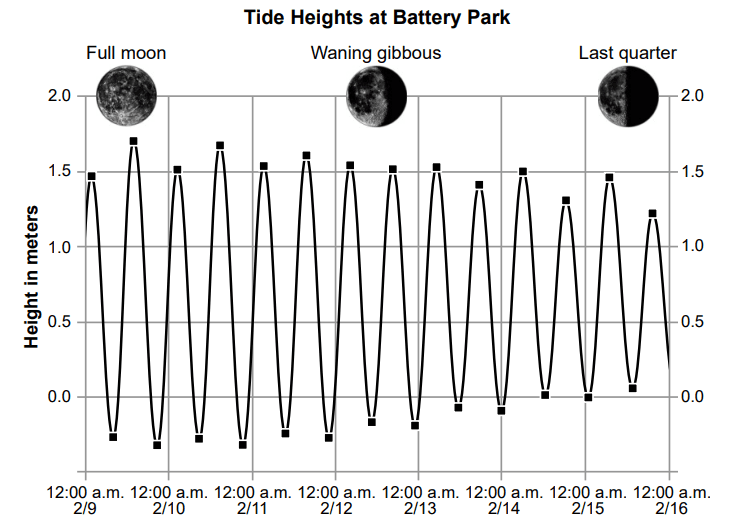
The graph below shows the ocean tides at Battery Park in New York City from February 9 to February 15, 2020. The phases of the Moon for select dates are shown at the top of the graph.
Compared to tides that occur during other Moon phases, which conclusion about tides that occur during a full moon can be made from the graph?

High tide is lower when there is a full moon.
Low tide is higher when there is a full moon.
The tidal range is greater when there is a full moon.
The tidal range is less when there is a full moon.
The heliocentric model of the solar system shows the
The graph below shows the ocean tides at Battery Park in New York City from February 9 to February 15, 2020. The phases of the Moon for select dates are shown at the top of the graph.
Compared to tides that occur during other Moon phases, which conclusion about tides that occur during a full moon can be made from the graph?
Evidence of Earth’s rotation on its axis is provided by both the
Orion is a constellation of stars that is visible in the evening sky in New York State from November through February. Orion is not visible the rest of the year because
The hydrosphere is a relatively thin layer of
Earth revolves around the Sun at a rate of approximately
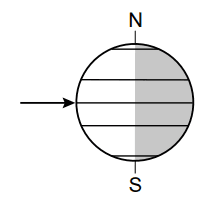
The diagram below represents Earth’s position relative to the Sun’s rays on September 23. The arrow shows the Sun’s direct rays striking the equator at solar noon.
During the next six months, the angle of the Sun’s rays striking the equator at solar noon will
Which type of unsaturated sediment will have the greatest permeability during a rainstorm?
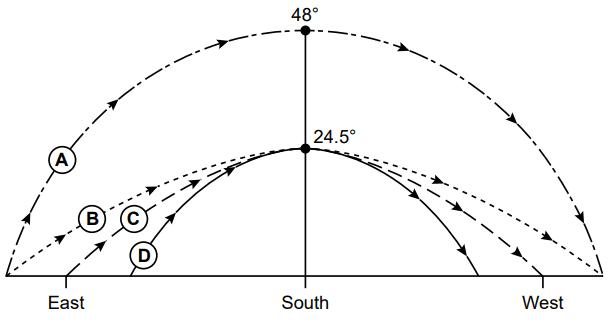
The diagram below represents four different apparent paths of the Sun across the sky at four different locations. The paths are labeled A, B, C, and D.
Which line best represents the apparent path of the Sun across the sky on December 21 in New York State?
Which table correctly indicates the locations of the polar front jet stream and subtropical jet stream near the time of the equinox?
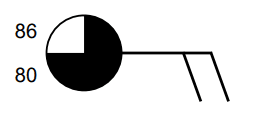
The station model below represents some weather conditions at Syracuse, New York.
What is the best description of the weather at Syracuse?
Which air mass is characterized by high relative humidity and low air temperature?
The incomplete flow chart below represents heat sources that provide energy for Earth’s systems. The types of heat sources, labeled A, B, and C, have been left blank.
Which flow chart correctly identifies the types of heat sources for A, B, and C?

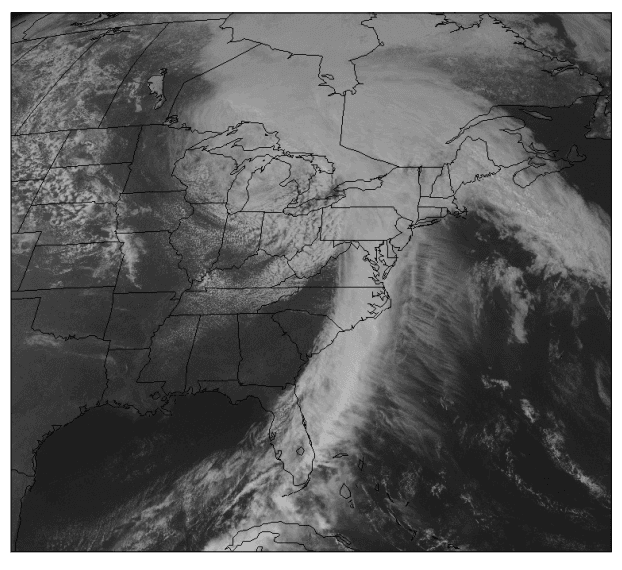
A visible satellite image of the eastern United States is shown below. Visible satellite images resemble black and white photographs because clouds reflect sunlight and appear white, while land and water appear in shades of gray or black.
Which weather variable can be most accurately forecast using this satellite image?
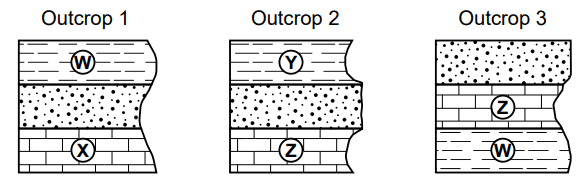
The cross sections below show widely separated outcrops labeled 1, 2, and 3. The rock layers have not been overturned. Letters W, X, Y, and Z represent fossils in some of the layers.
Which column represents the correct sequence of fossils based on the correlation of the three outcrops?
Which land surface absorbs the greatest amount of insolation?
During which era of Earth’s geologic history did oceanic oxygen begin to enter Earth’s atmosphere?
When did humans appear on Earth?
The Alleghenian and Acadian orogenies were caused by which geologic process?
The continents of Africa and South America were inferred to be two separate continents
Which surface feature was produced by crustal movements at a divergent plate boundary?
Which Earth layer has a density similar to the density of Mercury?
Which factor is primarily responsible for the development of the stream drainage patterns in New York State?
Which processes result in the formation of soil?
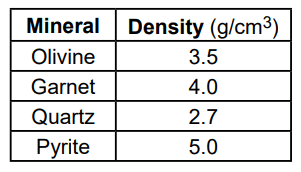
The table below shows the densities of four mineral samples of equal size and shape transported in a stream.
As this stream flows into a lake, which mineral sample would most likely be deposited first?
Hematite and magnetite are mined as ores because they contain the element
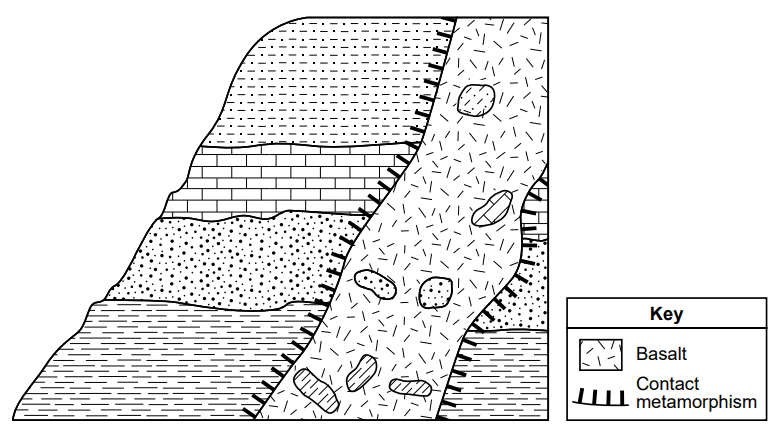
The cross section below represents a portion of Earth’s crust. The basalt intrusion contains several inclusions.
The relative age of the limestone inclusion is
The block diagram below represents the magnetic orientation of igneous bedrock on the seafloor on the western and eastern sides of a mid-ocean ridge. The letters A, B, C, D, and X identify locations of specific bands of magnetic orientation.
Which location is the same age as location X ?

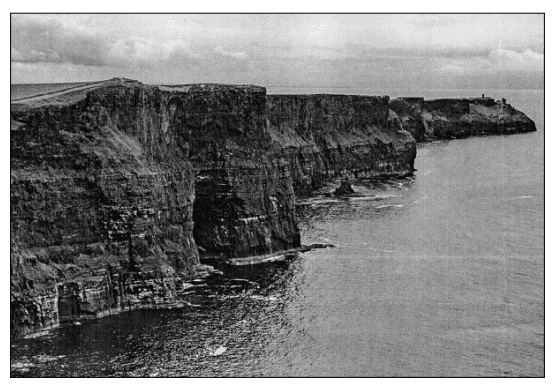
The photograph below shows an escarpment feature formed by uplift and erosion.
An escarpment is best described as a
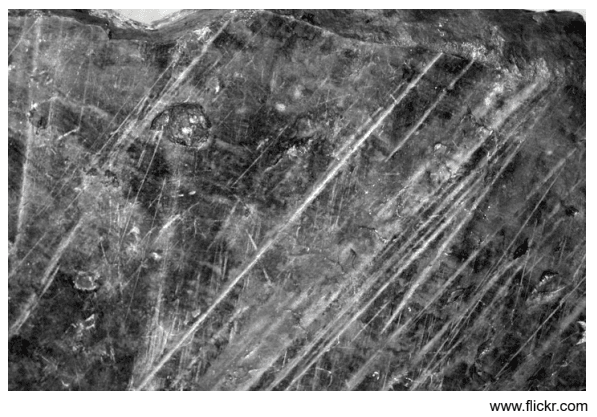
The photograph below shows parallel scratches on the surface of a rock.
Which erosional agent most likely produced these parallel scratches?
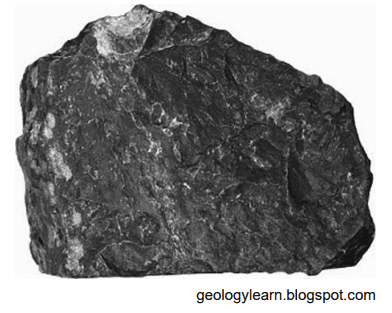
The picture below shows a sample of the metamorphic rock hornfels.
Hornfels is commonly formed when existing rock is changed due to
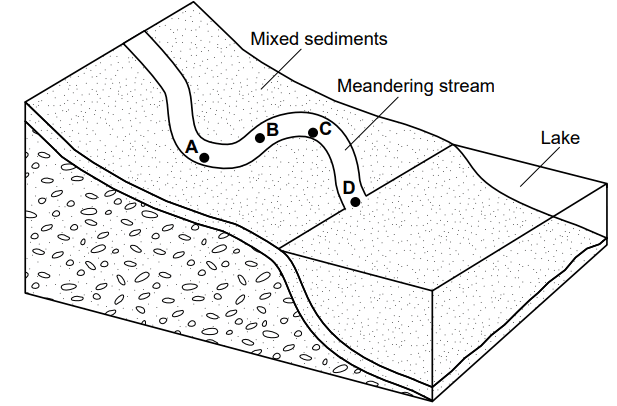
The diagram below represents a stream entering a lake. Letters A, B, C, and D represent locations in the stream.
At which two locations in the stream will the greatest amount of deposition be occurring?
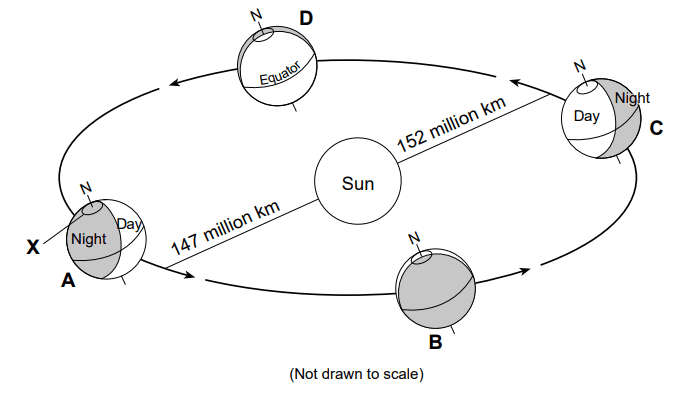
The diagram represents Earth orbiting the Sun. Four positions of Earth in its orbit are labeled A, B, C, and D. Letter N represents the North Pole. Distances are indicated for aphelion (Earth’s farthest position from the Sun) and perihelion (Earth’s closest position to the Sun). Arrows indicate directions of movement. Letter X represents a latitude on Earth.
Approximately how many days does Earth take to move from position A to position D?
The diagram represents Earth orbiting the Sun. Four positions of Earth in its orbit are labeled A, B, C, and D. Letter N represents the North Pole. Distances are indicated for aphelion (Earth’s farthest position from the Sun) and perihelion (Earth’s closest position to the Sun). Arrows indicate directions of movement. Letter X represents a latitude on Earth.
Which latitude on Earth is represented by location X?

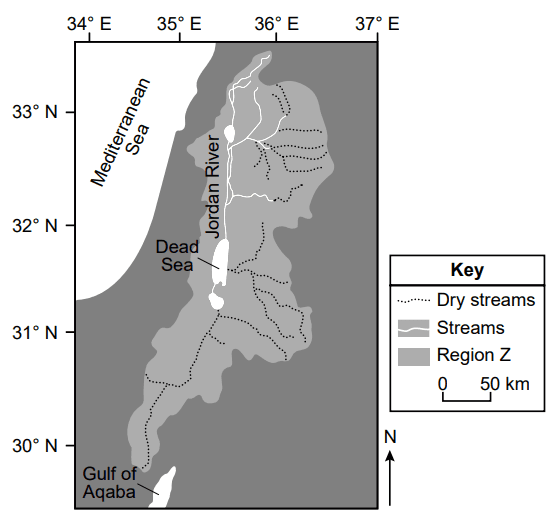
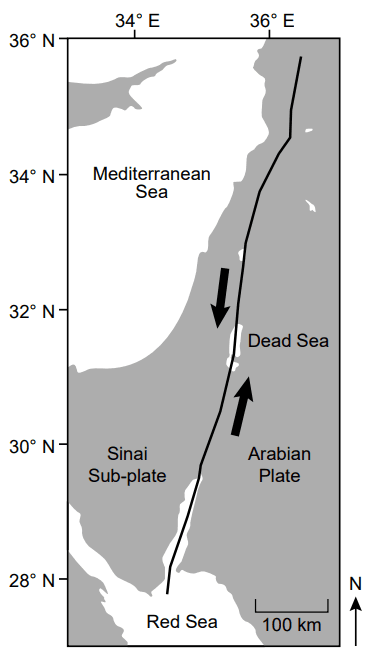
The Dead Sea is the lowest point on the surface of Earth. The Dead Sea is actually a lake which lies at the mouth of the Jordan River. The water is famous because it is 10 times saltier than the ocean. Small amounts of dissolved minerals are transported into the Dead Sea. Over thousands of years these minerals are left behind when the water evaporates. Recent demand for water in the region has increased significantly and has led to a decrease in the water level of the Dead Sea. In 1896, the lake surface was 1296 feet below sea level, and in 2016 the lake surface was 1412 feet below sea level. The fresh water of the Jordan River must now flow farther to reach the Dead Sea. As it flows, the fresh water of the river dissolves the layers of minerals previously deposited around the Dead Sea.
Which mineral is most commonly found on the shores of the Dead Sea?

The Dead Sea is the lowest point on the surface of Earth. The Dead Sea is actually a lake which lies at the mouth of the Jordan River. The water is famous because it is 10 times saltier than the ocean. Small amounts of dissolved minerals are transported into the Dead Sea. Over thousands of years these minerals are left behind when the water evaporates. Recent demand for water in the region has increased significantly and has led to a decrease in the water level of the Dead Sea. In 1896, the lake surface was 1296 feet below sea level, and in 2016 the lake surface was 1412 feet below sea level. The fresh water of the Jordan River must now flow farther to reach the Dead Sea. As it flows, the fresh water of the river dissolves the layers of minerals previously deposited around the Dead Sea.
The map below shows the tectonic plate boundary located at the Dead Sea.
Which type of tectonic plate boundary is found where the Dead Sea is located?
The seismogram and data table have information about an earthquake recorded at a seismic monitoring station.
At what time did this earthquake occur?
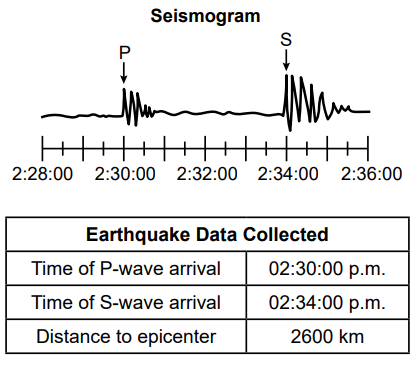
Which seismogram was recorded closest to the epicenter of this earthquake?
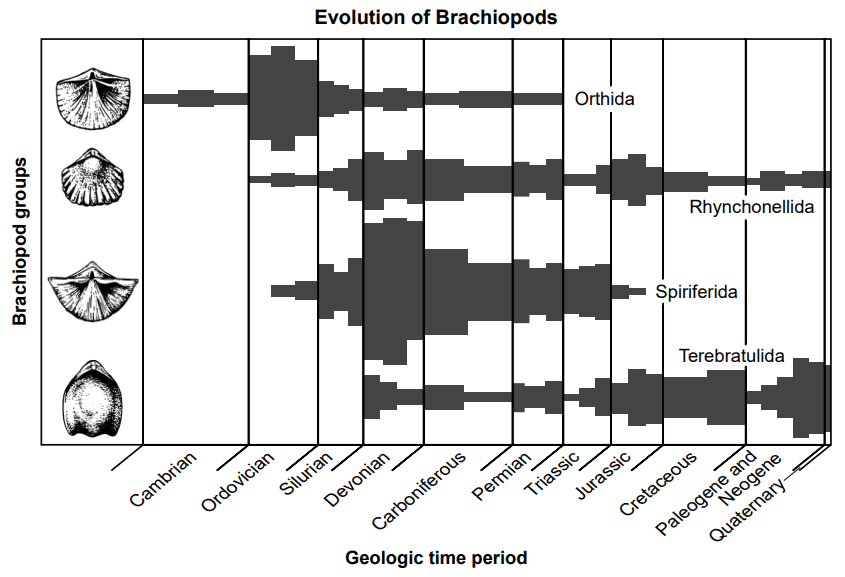
The graph indicates changes in the number of four different brachiopod groups from the early Cambrian to the present. A picture of a representative member of each group is shown in the left column. The width of each bar indicates the relative number of different types of brachiopods within each group.
What does this graph indicate about the history of the Orthida group?

The graph indicates changes in the number of four different brachiopod groups from the early Cambrian to the present. A picture of a representative member of each group is shown in the left column. The width of each bar indicates the relative number of different types of brachiopods within each group.
Which two other fossil groups found in New York State first appeared on Earth during the same geologictime period that the Orthida Brachiopod group first appeared?
The graph indicates changes in the number of four different brachiopod groups from the early Cambrian to the present. A picture of a representative member of each group is shown in the left column. The width of each bar indicates the relative number of different types of brachiopods within each group.
Which brachiopod group had the greatest number of types of organisms existing at the time of existence of the New York State index fossil Platyceras?

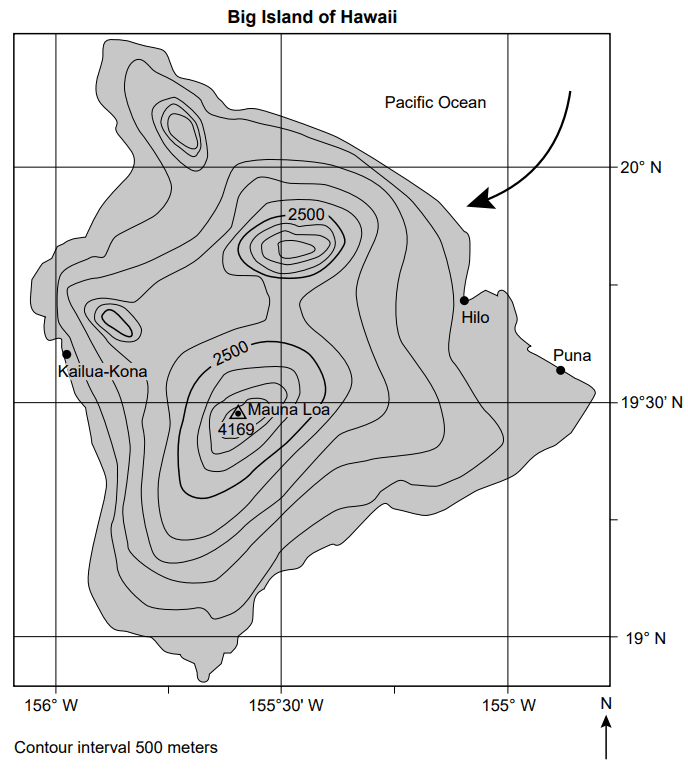
The contour map shows elevations in meters on the Big Island of Hawaii. The elevation of Mauna Loa, a volcanic mountain, is indicated. The large arrow represents the direction of prevailing winds.
Compared to Kailua-Kona, the amount of rainfall received at Hilo is
The contour map shows elevations in meters on the Big Island of Hawaii. The elevation of Mauna Loa, a volcanic mountain, is indicated. The large arrow represents the direction of prevailing winds.
After visible light is absorbed by the land surfaces of the Big Island of Hawaii, which form of long-wave electromagnetic energy is radiated?

The contour map shows elevations in meters on the Big Island of Hawaii. The elevation of Mauna Loa, a volcanic mountain, is indicated. The large arrow represents the direction of prevailing winds.
Compared to Puna, Mauna Loa has a cooler climate because Mauna Loa

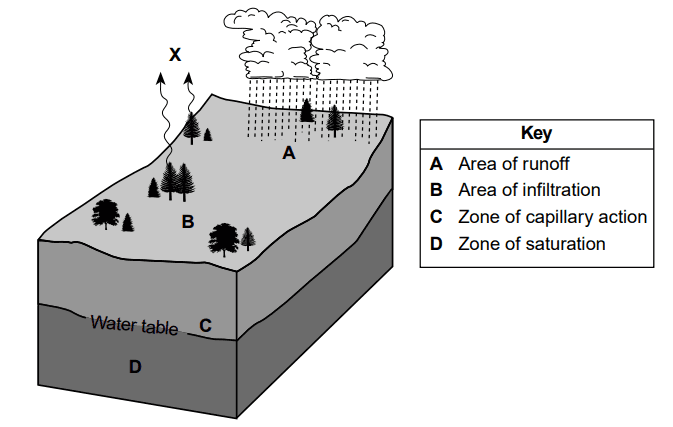
The block diagram shows a portion of Earth’s crust and some processes within the water cycle. Letters A, B, C, and D represent different areas and zones on the diagram. Letter X represents a water cycle process.
An increase in yearly precipitation would most likely cause

The block diagram shows a portion of Earth’s crust and some processes within the water cycle. Letters A, B, C, and D represent different areas and zones on the diagram. Letter X represents a water cycle process.
Process X, labeled in the diagram, represents