Loading...
Thursday Night Lights TEKS 3.8A Analyzing graphs
Quiz by Dr. Nnenna Wilson, MPH, Ph.D.
Track each student's skills and progress in your Mastery dashboards
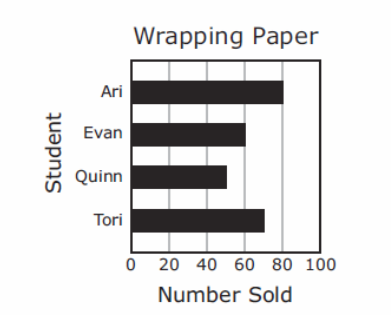
The graph shows the number of rolls of wrapping paper sold by four students.
Which table represents the information in the graph?


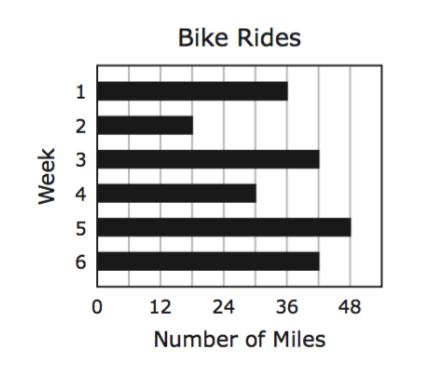
The graph below shows the number of miles Lincoln rod his bike during six weeks.
Which table represents the information in the graph?


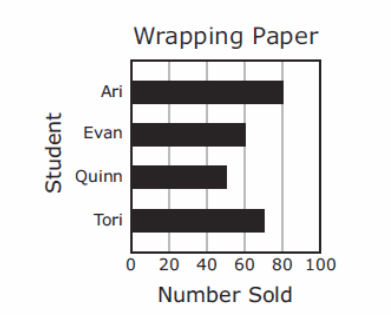
The graph shows the number of rolls of wrapping paper sold by four students.
Which table represents the information in the graph?
The graph below shows the number of miles Lincoln rod his bike during six weeks.
Which table represents the information in the graph?

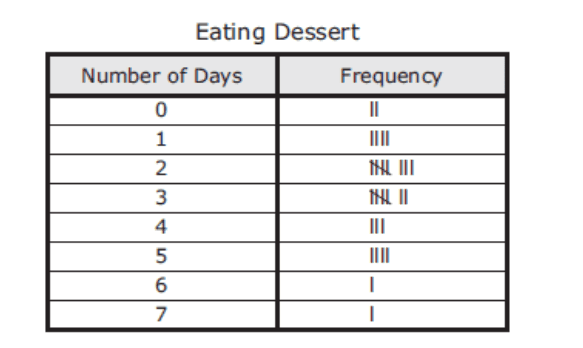
The frequency table shows the results of a survey about how many days per week some families eat dessert.
Which dot plot represents the data in the table?
The bar graph shows the number of third graders who brought lunch to school each day last week.
Which table best represents the data in the graph?

Merlin had a bag of tiles. Each tile was labeled with a number. Merlin pulled one tile out of the bag and recorded the number on that tile. He repeated this 18 times. The numbers on the tiles Merlin pulled are shown on the list.
Which dot plot represents the numbers on the tiles Merlin pulled out of the bag?

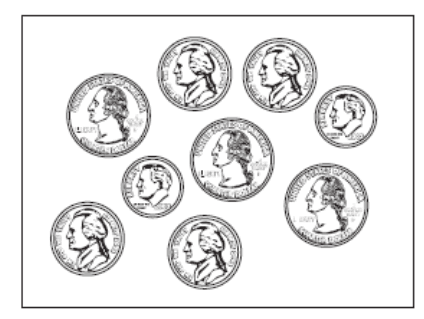
The picture shows the coins that are in a piggy bank.
Which dot plot represents the value in cents of each coin in the piggy bank?